
China's government sets the operating rules for listed companies, so regulatory decisions can move through to earnings. Sector-focused funds may feel that more acutely than composite index funds do.
These eight ETFs aim to track Chinese equity indices, each following a benchmark built around a different part of the market – broad composites, mainland-listed A-shares, Hong Kong-listed large-caps, and sector-focused benchmarks covering internet and technology companies. Annual fees across the funds here run from 0.19% for Franklin FTSE China ETF ($FLCH) to 0.74% for iShares China Large-Cap ETF ($FXI).
How we built this list: We selected these funds based on their investment category and relevance to the theme, then ordered them by assets under management. Prices are updated daily, and the list and supporting content are reviewed roughly every quarter. All data is sourced from Stake. This list isn't a recommendation and isn't ordered by suitability.
ETF Name | Ticker | Share Price | AUM | Expense Ratio | In Watchlists |
|---|---|---|---|---|---|
iShares MSCI China ETF | $49.00 | $5.50B | 0.59% | 822 | |
KraneShares CSI China Internet ETF | $23.14 | $4.27B | 0.69% | 1202 | |
iShares China Large-Cap ETF | $32.31 | $3.72B | 0.74% | 812 | |
Invesco China Technology ETF | $40.26 | $1.92B | 0.65% | 995 | |
Xtrackers Hvst CSI 300 China A Shs ETF Class A | $30.74 | $1.32B | 0.65% | 198 | |
State Street SPDR S&P China ETF | $81.21 | $421.7M | 0.59% | 263 | |
WisdomTree China ex-State-Owned Enterprises Fund | $32.24 | $377.3M | 0.32% | 76 | |
Franklin FTSE China ETF | $19.42 | $250.9M | 0.19% | 69 |
Past performance is not a reliable indicator of future performance.
Source: Stake market data. Figures in US$. Data updated as of 23 October 2026.
✅ Learn more: Top 5 cybersecurity ETFs to watch in 2026→
Sign up in minutes and get access to a CHESS-sponsored platform, where you can explore Chinese ETFs and more.
1. iShares MSCI China ETF ($MCHI)
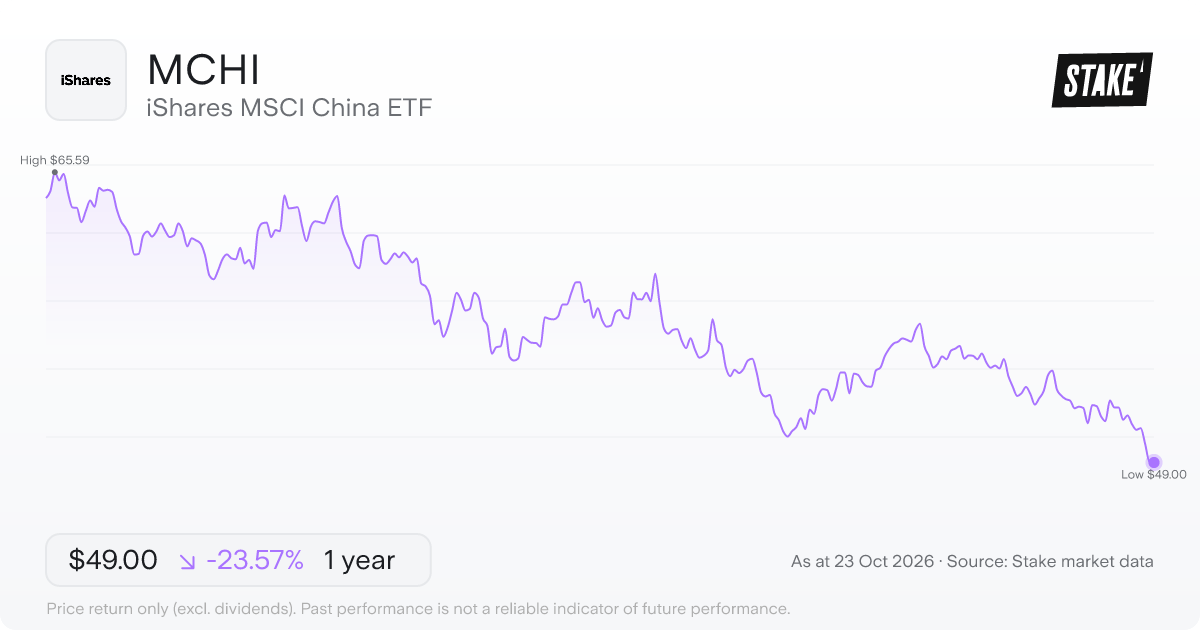
Price: US$49.00 · Daily: -0.04% · AUM: US$5.50B · MER: 0.59%
The iShares MSCI China ETF ($MCHI) aims to track an index of Chinese equities constructed for international investors. The underlying index is scoped to shares that foreign buyers can access – not all Chinese-listed stocks are open to outside ownership, so this design reflects a practical constraint built into the benchmark itself.
To replicate that index, $MCHI is designed to hold at least 90% of its assets in the index's constituent securities and in depositary receipts representing those same companies. Depositary receipts are instruments that allow shares listed in one market to be held and traded in another. That mix of direct securities and depositary receipts reflects the different ways Chinese company shares can be listed and accessed internationally.
2. KraneShares CSI China Internet ETF ($KWEB)
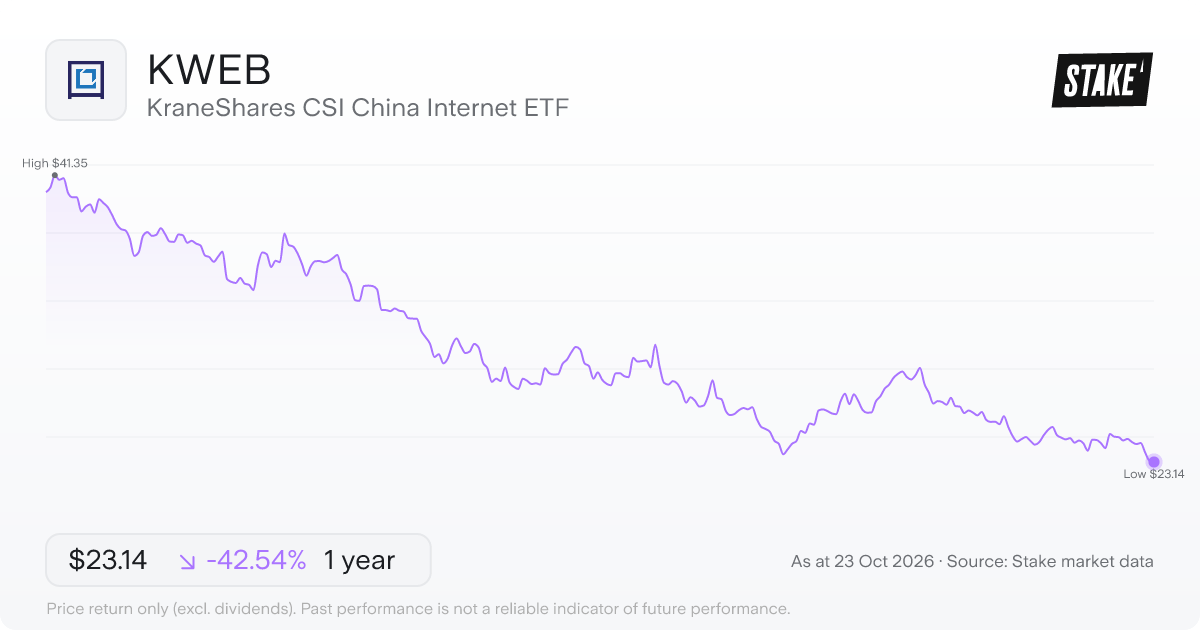
Price: US$23.14 · Daily: -0.3% · AUM: US$4.27B · MER: 0.69%
Focused on publicly traded China-based companies in the internet sector, KraneShares CSI China Internet ETF ($KWEB) is designed to track the price and yield performance of an index built around that segment of the market. The underlying benchmark aims to represent the investable universe of those firms – the set of companies that are publicly listed and available to investors.
China's internet sector brings together businesses across e-commerce, social media, online search, and digital services. $KWEB concentrates on that specific corner of the Chinese market rather than tracking a broad cross-section of Chinese equities. The fund's holdings are determined by the underlying index, with composition shifting whenever the benchmark is rebalanced.
3. iShares China Large-Cap ETF ($FXI)
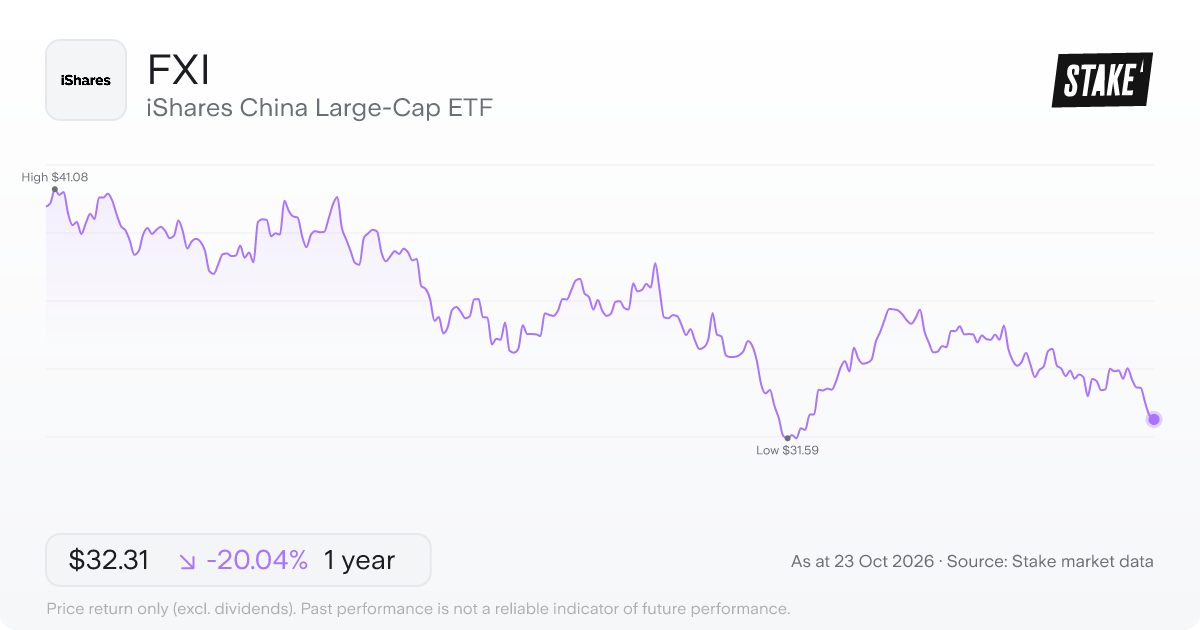
Price: US$32.31 · Daily: -0.4% · AUM: US$3.72B · MER: 0.74%
The iShares China Large-Cap ETF ($FXI) aims to track the FTSE China 50 Index, which is built around Chinese companies listed on the Hong Kong Stock Exchange. The benchmark holds 50 of the largest and most liquid names in that market. The index covers Hong Kong-listed shares, not the A-shares traded on mainland Chinese exchanges. The 50-stock construction keeps the portfolio concentrated within that part of Chinese equities.
4. Invesco China Technology ETF ($CQQQ)
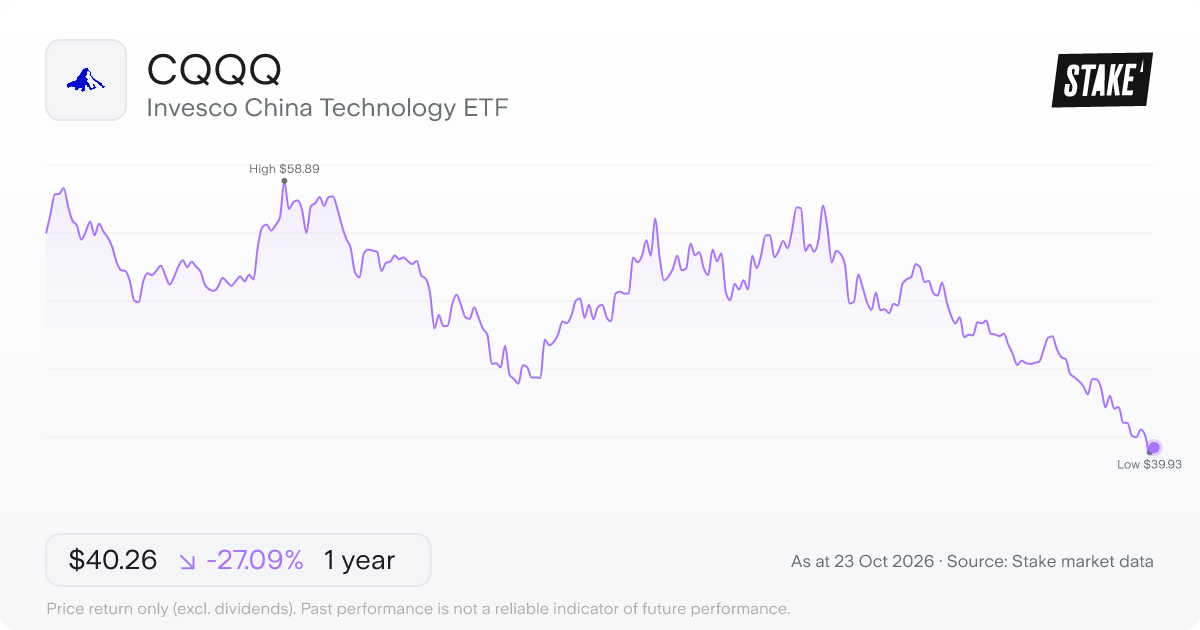
Price: US$40.26 · Daily: 0.8% · AUM: US$1.92B · MER: 0.65%
Invesco China Technology ETF ($CQQQ) aims to track the FTSE China Incl A 25% Technology Capped Index, which covers technology-classified companies in China. The index applies a capping methodology to limit concentration in individual securities.
The fund is designed to hold at least 90% of its assets in the index's constituents, a pool that can include American depositary receipts (ADRs) and global depositary receipts (GDRs) representing those same underlying holdings. That structure allows $CQQQ to access Chinese technology companies across different listing formats, not only those traded directly on mainland or Hong Kong exchanges.
Join 1M+ on Stake
Effortless investing in U.S. shares & ETFs
5. Xtrackers Hvst CSI 300 China A Shs ETF Class A ($ASHR)
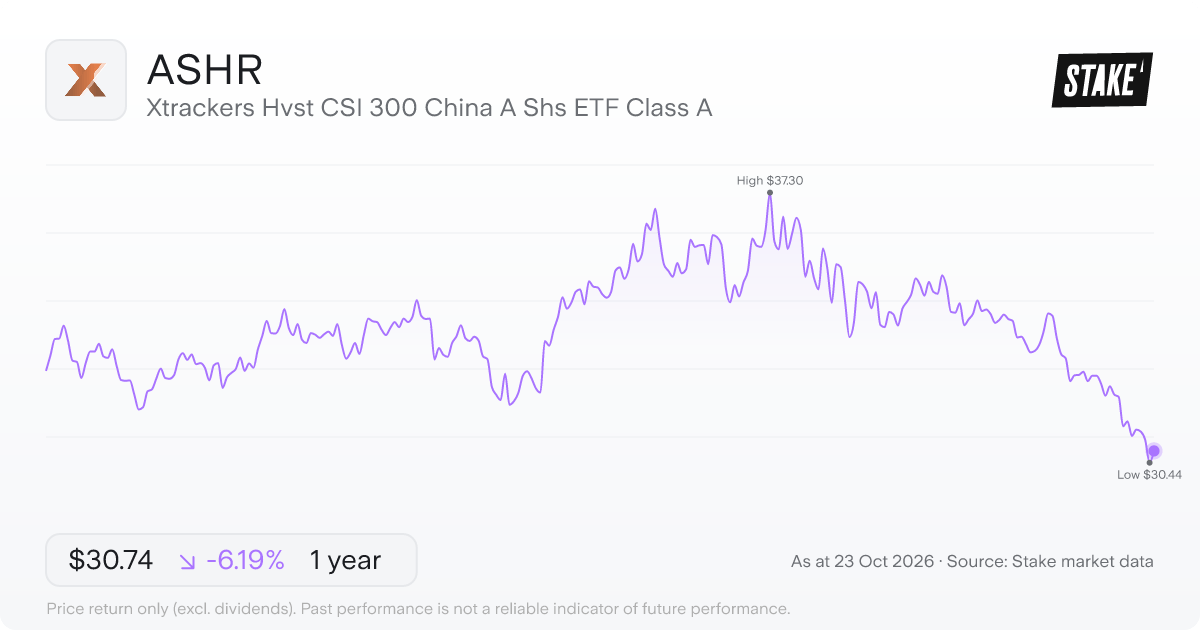
Price: US$30.74 · Daily: 1.0% · AUM: US$1.32B · MER: 0.65%
Xtrackers Hvst CSI 300 China A Shs ETF Class A ($ASHR) aims to track the CSI 300 Index, a benchmark designed to reflect the price performance of China's A-share market. The index draws from the 300 largest and most liquid stocks in that market. Those constituents give $ASHR its shape – concentrated at the upper end of the A-share universe by both size and trading activity.
6. State Street SPDR S&P China ETF ($GXC)
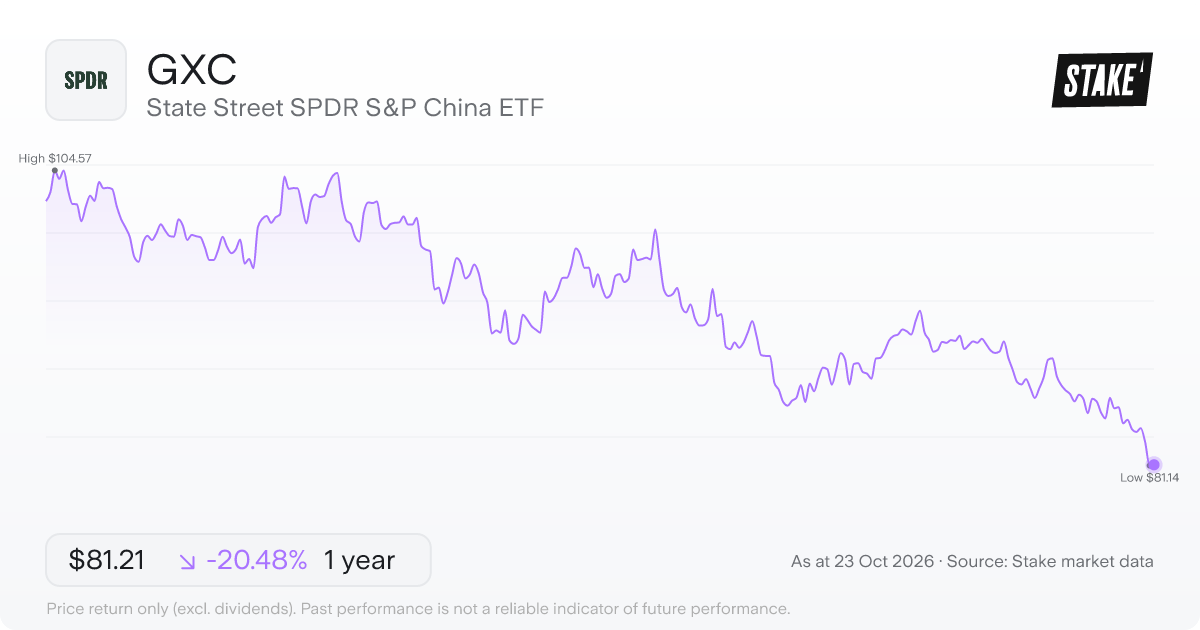
Price: US$81.21 · Daily: 0.09% · AUM: US$421.7M · MER: 0.59%
State Street SPDR S&P China ETF ($GXC) aims to replicate the total return performance of the S&P/Citigroup BMI China Index, a composite benchmark covering the Chinese equity market. The fund uses a passive management strategy designed to track that index as closely as possible.
Unlike funds focused on a single listing venue or market segment, $GXC is built around a composite index – meaning it is intended to capture a broader cross-section of Chinese equities rather than concentrating on one particular slice. That construction makes it distinct from funds tied specifically to A-shares or Hong Kong-listed names.
7. WisdomTree China ex-State-Owned Enterprises Fund ($CXSE)
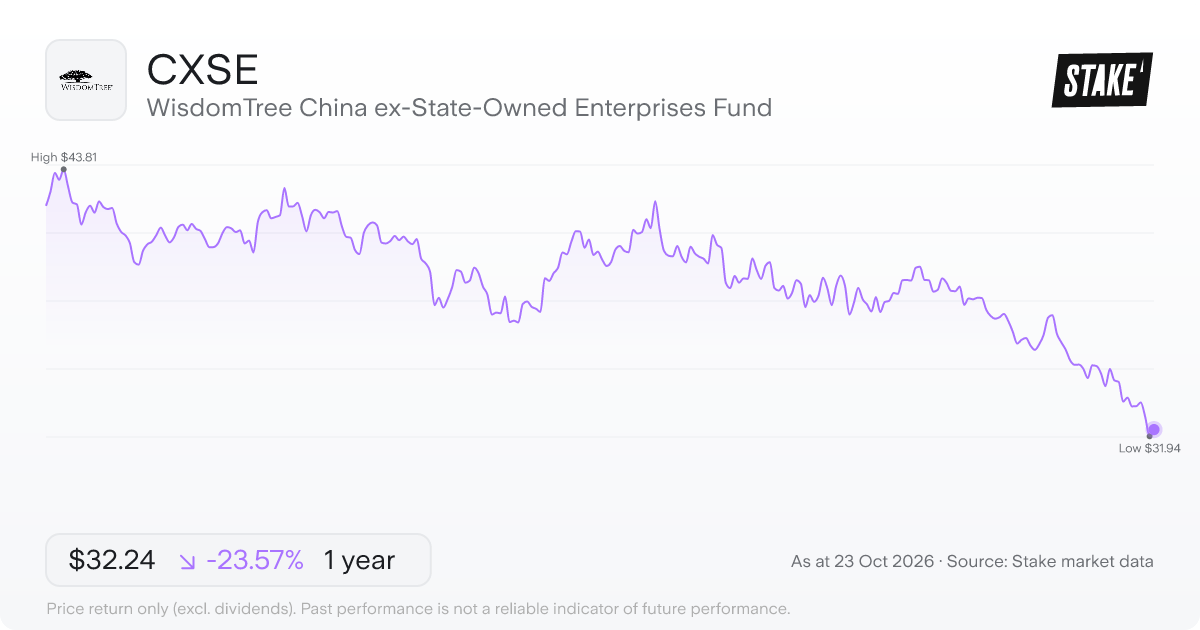
Price: US$32.24 · Daily: 0.9% · AUM: US$377.3M · MER: 0.32%
The WisdomTree China ex-State-Owned Enterprises Fund ($CXSE) aims to track the WisdomTree China ex-State-Owned Enterprises Index – a float-adjusted, market cap weighted index of Chinese common stocks. The defining feature is the exclusion filter: any company where government ownership exceeds 20% is left out of the index entirely.
That construction means $CXSE is oriented toward privately run Chinese businesses rather than the large state-backed banks, energy groups and telecoms that make up a significant chunk of broader China benchmarks. The fund treats any company with more than 20% government ownership as a state-owned enterprise, and the threshold applies consistently across the index. The result is a portfolio shaped by China's private sector, weighted by the free-float portion of each company's shares.
8. Franklin FTSE China ETF ($FLCH)
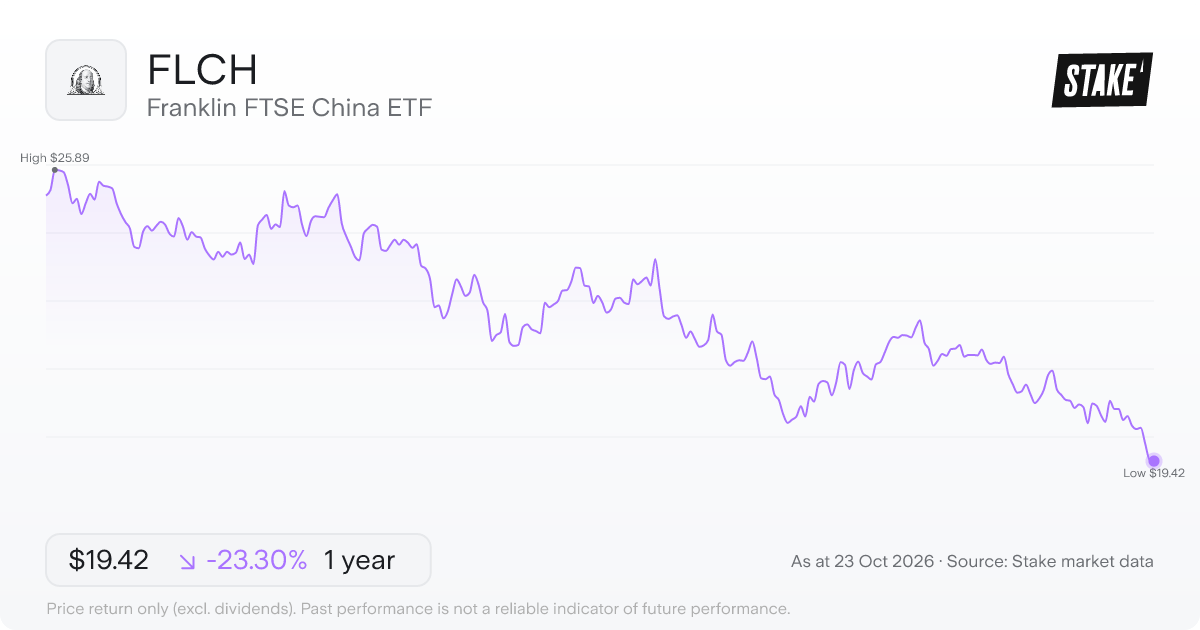
Price: US$19.42 · Daily: -0.2% · AUM: US$250.9M · MER: 0.19%
Franklin FTSE China ETF ($FLCH) aims to track the FTSE China RIC Capped Index, a benchmark built around Chinese large- and mid-capitalisation stocks. The fund is designed to invest at least 80% of its assets in the index's component securities, keeping it closely tied to the underlying benchmark.
RIC Capped refers to a regulatory investment company capping methodology, which limits the weight any single holding can reach within the index. That construction is intended to prevent a handful of large companies from dominating the fund's returns. $FLCH covers both mainland-listed and Hong Kong-listed Chinese equities within the large- and mid-cap range, giving the portfolio a broad sweep of the Chinese equity market.
➡️ Top 10 Asia ETFs to watch in 2026→
Common questions
How do I invest in Chinese ETFs in Australia?
All eight funds in this list are listed on U.S. exchanges, so you'll need a brokerage or trading platform that provides access to U.S. markets. Each fund trades like a share – you search by ticker and place an order during U.S. market hours. The fund holds the underlying Chinese equities, so one transaction covers the fund's entire portfolio.
What are the key risks of Chinese ETFs?
Some of the key risks include regulatory changes in China, which can affect specific sectors or companies quickly and with little warning. Geopolitical tension between China and other major economies can also move prices sharply. Because all the funds in this list are priced in USD, movements between the Australian dollar and the US dollar affect both what a purchase costs and what proceeds are worth in AUD. Sector-focused funds like $KWEB and $CQQQ carry additional concentration risk – a shift in one industry lands harder on a narrow fund than it would on a broad-market equivalent.
What's the difference between China A-shares and Hong Kong-listed Chinese stocks?
China A-shares are shares of mainland Chinese companies traded on the Shanghai and Shenzhen exchanges. $ASHR tracks the CSI 300 Index, which covers the 300 largest and most liquid stocks in that market. $FXI follows a different benchmark – the FTSE China 50 Index – built around Chinese companies listed on the Hong Kong Stock Exchange, which is a separate pool of stocks from the mainland exchanges. Both count as Chinese equities, but they draw from distinct markets and can include different companies.
What does excluding state-owned enterprises mean for a fund's holdings?
$CXSE removes any company where government ownership exceeds 20%, which means the large state-backed banks, energy groups and telecoms that feature in many broader China benchmarks are left out of the portfolio entirely. What remains is a fund oriented toward privately run Chinese businesses, weighted by each company's freely traded shares. That construction gives $CXSE a meaningfully different sector composition compared to funds that include state-owned enterprises.
More resources
✅ Top 9 Nasdaq ETFs to watch in 2026→
Disclaimer
Past performance is not a reliable indicator of future performance. When you invest, your capital is at risk. You should consider your own investment objectives, financial situation, and particular needs before making an investment decision. The value of your investments can go down as well as up and you may receive back less than your original investment. As always, do your own research and consider seeking appropriate financial advice before investing.
This is not personal financial advice nor a recommendation to invest in the securities listed. Any advice provided by Stake is of general nature only and does not take into account your specific circumstances. Trading and volume data from the Stake investing platform is for reference purposes only, the investment choices of others may not be appropriate for your needs and is not a reliable indicator of performance.
Please refer to hellostake.com/pricing for the fees that apply. When you trade securities priced in another currency, currency conversion fees may apply and movements in the exchange rate may affect your returns.

Stake Desk
The freshest market insights
This article combines AI and human review from our analysts to bring you accurate, informative investing content at speed. For questions or suggestions, contact stakedesk@stake.com.au.
Subscribe
By subscribing, you agree to our Privacy Policy.