
Top 10 defence stocks to watch in 2026
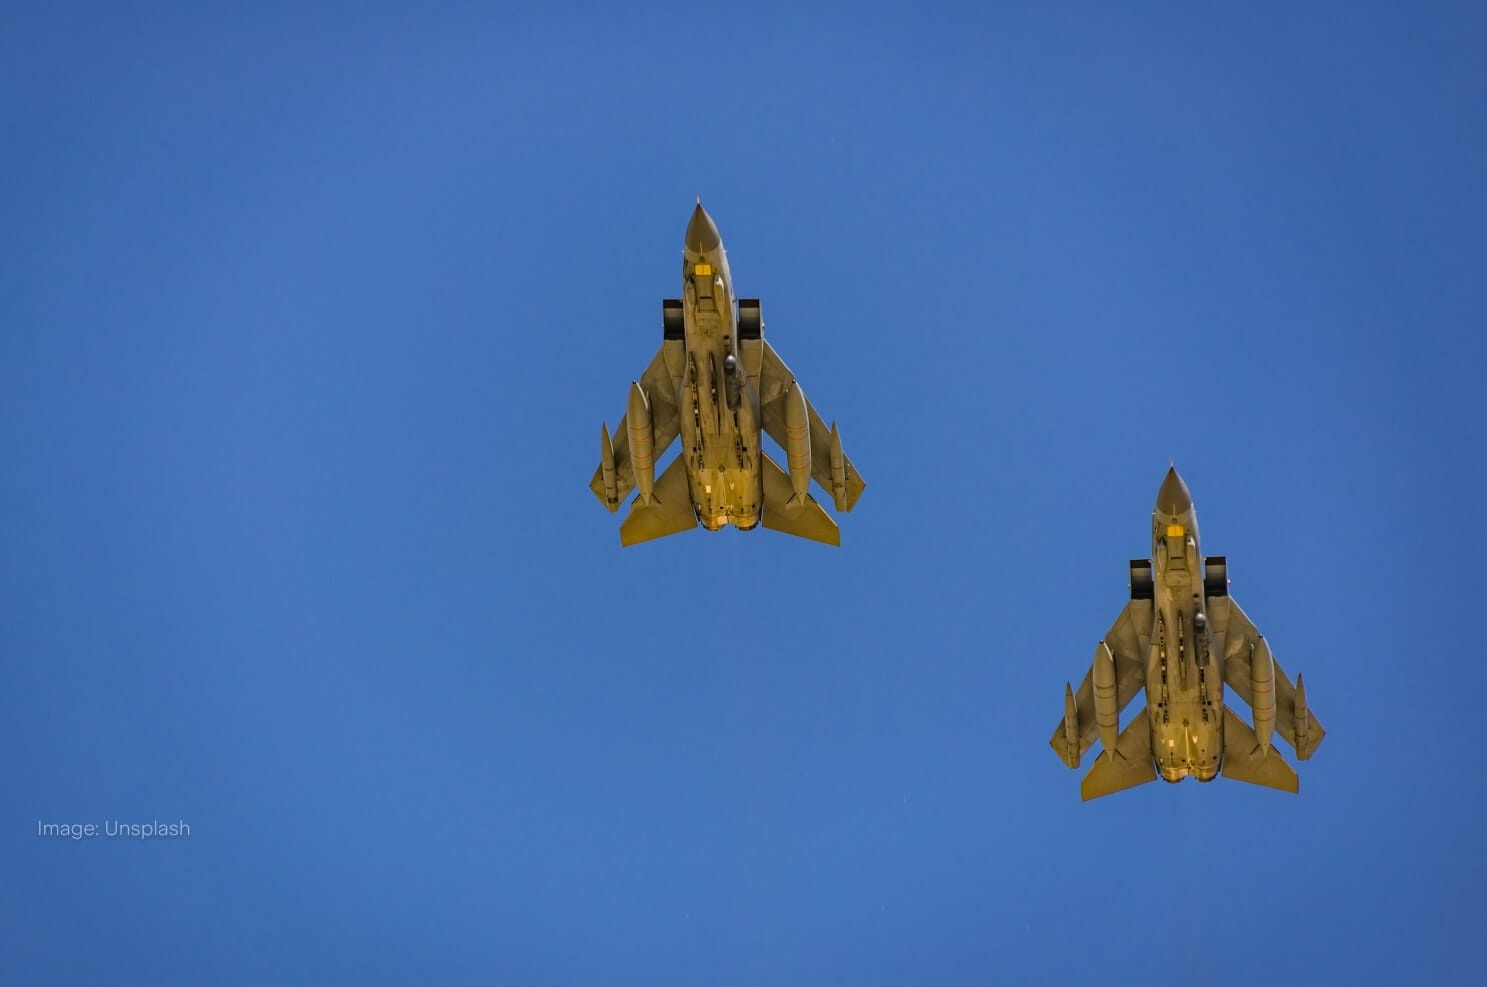
Most of these companies build physical hardware while one sells software and IT services to government.
Defence stocks are companies that build military aircraft, missile systems, submarines and surveillance technology primarily for government customers. Nine of the ten names here manufacture hardware and sit in the Industrials sector; Leidos Holdings ($LDOS) is different, providing software and IT services to defence and intelligence agencies instead.
How we built this list: We selected these companies based on their industry and ordered them by market capitalisation. Prices are updated daily, and the list and supporting content are reviewed roughly every quarter. All data is sourced from Stake. This list isn't a recommendation and isn't ordered by suitability.
Company Name | Ticker | Share Price | Market Cap | In Watchlists |
|---|---|---|---|---|
RTX | $183.29 | $248.43B | 5386 | |
Boeing | $189.82 | $152.32B | 12384 | |
Lockheed Martin | $510.12 | $116.93B | 11115 | |
General Dynamics | $331.33 | $89.75B | 2556 | |
Northrop Grumman | $483.11 | $67.64B | 4058 | |
TransDigm Group | $1,103.33 | $60.40B | 602 | |
L3Harris Technologies | $237.90 | $44.11B | 1581 | |
Curtiss-Wright | $553.35 | $19.97B | 157 | |
Leidos Holdings | $116.69 | $14.99B | 699 | |
Kratos Defense | $43.71 | $7.89B | 2841 |
Past performance is not a reliable indicator of future performance.
Source: Stake market data. Figures in US$. Data updated as of 6 October 2026.
✅ Learn more: Top 8 defence ETFs to watch in 2026→
1. RTX ($RTX)

RTX (RTX) share price over the last year: started at US$168.80, ended at US$183.29, a change of +8.6%. Range over the period: high US$225.49, low US$157.00. Source: Stake market data. Past performance is not a reliable indicator of future performance.
Price: US$183.29 · Daily: -0.6% · Market cap: US$248.43B · Sector: Industrials · Industry: Aerospace & Defence
RTX Corporation ($RTX) runs three distinct businesses under one roof. Collins Aerospace makes equipment and aftermarket services for both civil and military aircraft. Pratt & Whitney builds the engines that power commercial jets, military aircraft and business jets. Raytheon handles the weapons and defence systems side – air and missile defence, smart weapons and threat-tracking technology for the U.S. government and foreign customers.
Under CEO Chris Calio, $RTX employs around 180,000 people globally. The breadth of that workforce reflects how much ground the company covers, from a single turbofan engine to a complete missile defence system.
Because the company sells to both commercial airlines and government defence agencies, its revenue picture is split between the cyclical rhythms of civil aviation and the longer contract cycles typical of government procurement.
2. Boeing ($BA)

Boeing (BA) share price over the last year: started at US$219.73, ended at US$189.82, a change of −13.6%. Range over the period: high US$252.15, low US$179.12. Source: Stake market data. Past performance is not a reliable indicator of future performance.
Price: US$189.82 · Daily: -1.5% · Market cap: US$152.32B · Sector: Industrials · Industry: Aerospace & Defence
Boeing ($BA) is one of the few names in this list that straddles two enormous markets. Under CEO Kelly Ortberg, the company's 182,000 employees work across commercial aviation, defence hardware and global services.
The defence side, run through the Defense, Space & Security segment, develops manned and unmanned military aircraft, weapons systems, and platforms covering strike, surveillance and mobility missions. Those programmes serve government customers rather than airlines.
The commercial segment produces the 737 narrow-body and the 767, 777 and 787 wide-body jets. The services arm – Global Services – supports both commercial and defence customers with maintenance, spare parts, pilot training and supply chain management.
That services business means $BA generates ongoing revenue long after an aircraft or system is delivered, though both the commercial and defence divisions carry their own execution and contract risks.
3. Lockheed Martin ($LMT)

Lockheed Martin (LMT) share price over the last year: started at US$514.24, ended at US$510.12, a change of −0.8%. Range over the period: high US$676.70, low US$439.19. Source: Stake market data. Past performance is not a reliable indicator of future performance.
Price: US$510.12 · Daily: 0.7% · Market cap: US$116.93B · Sector: Industrials · Industry: Aerospace & Defence
Lockheed Martin ($LMT) operates across four segments covering aircraft, missiles, rotorcraft and space. Its Aeronautics segment builds and sustains advanced military aircraft, including combat jets and unmanned vehicles. The Missiles and Fire Control division produces precision strike weapons and air defence systems, while the Rotary and Mission Systems arm handles military helicopters and sea and land-based missile defence.
The Space segment rounds out the business, working on satellites, space transportation systems and strategic strike capabilities. Across all four divisions, the company employs around 123,000 people and sells almost exclusively to government customers. Chief executive Jim Taiclet has steered the business through a period of shifting defence procurement priorities, with the product range stretching from aircraft sustainment contracts to next-generation space systems.
4. General Dynamics ($GD)

General Dynamics (GD) share price over the last year: started at US$346.50, ended at US$331.33, a change of −4.4%. Range over the period: high US$395.97, low US$312.53. Source: Stake market data. Past performance is not a reliable indicator of future performance.
Price: US$331.33 · Daily: -0.1% · Market cap: US$89.75B · Sector: Industrials · Industry: Aerospace & Defence
General Dynamics ($GD) runs four distinct businesses under one roof: business jets, nuclear submarines, land combat vehicles and defence technology services. The Marine Systems segment designs and builds nuclear-powered submarines for the U.S. Navy, while Combat Systems produces wheeled and tracked vehicles, weapons systems and munitions for land forces around the world.
The Aerospace segment manufactures business jets and handles aircraft repair and custom completion work. Meanwhile, the Technologies segment delivers IT services and products across military, intelligence and federal civilian customers – making $GD one of the few defence names that straddles both hardware manufacturing and government technology services.
5. Northrop Grumman ($NOC)

Northrop Grumman (NOC) share price over the last year: started at US$618.52, ended at US$483.11, a change of −21.9%. Range over the period: high US$768.02, low US$476.11. Source: Stake market data. Past performance is not a reliable indicator of future performance.
Price: US$483.11 · Daily: 1.5% · Market cap: US$67.64B · Sector: Industrials · Industry: Aerospace & Defence
Northrop Grumman ($NOC) operates across four segments that cover nearly every corner of modern defence hardware. Aeronautics Systems builds military aircraft for the U.S. Air Force, the U.S. Navy and international customers. Defense Systems focuses on tactical weapons and missile defence, while Space Systems handles satellites, launch systems and missile defence infrastructure.
Mission Systems rounds out the portfolio with command, control, communications and reconnaissance technology – the electronics that tie a military operation together. Chief executive Kathy Warden leads a workforce of 95,000 people. $NOC's breadth means it's involved in programmes from bomber aircraft to space launch, with the U.S. government as its primary customer across most of them.
6. TransDigm Group ($TDG)

TransDigm Group (TDG) share price over the last year: started at US$1,291.74, ended at US$1,103.33, a change of −14.6%. Range over the period: high US$1,450.00, low US$1,076.01. Source: Stake market data. Past performance is not a reliable indicator of future performance.
Price: US$1,103.33 · Daily: 1.0% · Market cap: US$60.40B · Sector: Industrials · Industry: Aerospace & Defence
TransDigm Group ($TDG) designs and produces highly engineered aircraft components used on nearly all commercial and military aircraft currently in service. Its product catalogue includes actuators, ignition systems, specialised pumps and valves, power conditioning devices, advanced sensors and cargo handling systems. The business groups these products into three segments – Power & Control, Airframe and Non-aviation – with Power & Control covering the electronics and mechanical technologies that manage how power moves through an aircraft. CEO Mike Lisman leads a workforce of 16,500 people across $TDG's wholly owned subsidiaries.
7. L3Harris Technologies ($LHX)

L3Harris Technologies (LHX) share price over the last year: started at US$303.01, ended at US$237.90, a change of −21.5%. Range over the period: high US$378.48, low US$236.47. Source: Stake market data. Past performance is not a reliable indicator of future performance.
Price: US$237.90 · Daily: 0.4% · Market cap: US$44.11B · Sector: Industrials · Industry: Aerospace & Defence
L3Harris Technologies ($LHX) connects military and government operations across five domains – space, air, land, sea and cyber – through four business segments. Its Space & Airborne Systems arm works as both a prime contractor and subsystem integrator for space and airborne missions, while the Integrated Mission Systems segment handles intelligence, reconnaissance and surveillance capabilities, along with electronic attack and autonomous systems.
The Communications Systems segment keeps warfighters connected across all domains, including in contested environments where signals are actively disrupted. The Aerojet Rocketdyne segment – added through acquisition – supplies propulsion, power and armament products to customers including the U.S. Department of Defense and NASA. $LHX employs around 45,000 people and is led by chief executive Chris Kubasik.
8. Curtiss-Wright ($CW)

Curtiss-Wright (CW) share price over the last year: started at US$554.06, ended at US$553.35, a change of −0.1%. Range over the period: high US$792.77, low US$532.36. Source: Stake market data. Past performance is not a reliable indicator of future performance.
Price: US$553.35 · Daily: 2.3% · Market cap: US$19.97B · Sector: Industrials · Industry: Aerospace & Defence
Curtiss-Wright Corporation ($CW) makes engineered products and services across three segments: Aerospace & Industrial, Defense Electronics, and Naval & Power. The naval and power side supplies things like main coolant pumps, seals and valves – components built for demanding environments rather than off-the-shelf applications.
Its 9,100 employees work across defence electronics, commercial aerospace and industrial markets. Chief executive Lynn Bamford oversees a business that counts both government defence programs and commercial power and process industries among its customers.
9. Leidos Holdings ($LDOS)

Leidos Holdings (LDOS) share price over the last year: started at US$198.04, ended at US$116.69, a change of −41.1%. Range over the period: high US$199.55, low US$100.00. Source: Stake market data. Past performance is not a reliable indicator of future performance.
Price: US$116.69 · Daily: -2.3% · Market cap: US$14.99B · Sector: Technology · Industry: Software & IT
Leidos Holdings ($LDOS) employs 47,000 people under chief executive Thomas Bell and operates across four business segments: National Security & Digital, Health & Civil, Commercial & International and Defense Systems. The company's core work covers software, IT services and data analytics, delivered mainly to government customers.
Its National Security & Digital arm works with defence and intelligence agencies on cyber operations, logistics and decision analytics. The Health & Civil segment applies a similar approach to public health, care coordination and federal transportation programmes. The Commercial & International segment focuses on securing national assets and modernising energy infrastructure for both government and commercial clients.
10. Kratos Defense ($KTOS)

Kratos Defense (KTOS) share price over the last year: started at US$100.25, ended at US$43.71, a change of −56.4%. Range over the period: high US$130.72, low US$42.02. Source: Stake market data. Past performance is not a reliable indicator of future performance.
Price: US$43.71 · Daily: 4.0% · Market cap: US$7.89B · Sector: Industrials · Industry: Aerospace & Defence
Kratos Defense & Security Solutions ($KTOS) builds technology products and systems for defence and national security customers, with most of its revenue coming from U.S. government agencies, the Department of Defense, and classified programmes. The company runs two segments: Kratos Government Solutions and Unmanned Systems. The first covers microwave electronics, satellite and cyber systems, training solutions, turbine technologies and rocket support services. The second focuses on unmanned aerial, ground and seaborne vehicles along with the command and control systems that operate them.
Under chief executive Eric DeMarco, $KTOS employs around 4,300 people. The unmanned systems side is a defining part of what sets the company apart from more traditional defence contractors – it designs and produces the drones and autonomous platforms themselves, not just the software or sensors that go on them.
➡️ Top 5 space stocks to watch in 2026→
Common questions
How to invest in defence stocks in Australia?
All ten stocks in this list trade on U.S. exchanges, so you'll need a share trading platform that provides access to U.S. markets. You buy them in U.S. dollars, which means the AUD/USD rate affects what your position is worth when converted back to Australian dollars.
What are the key risks of defence stocks?
Government budget decisions are the central pressure point – these companies rely heavily on contracts from the U.S. Department of Defense and allied governments, so shifts in defence spending priorities can flow directly into revenues. Fixed-price development contracts carry the risk of cost overruns that compress margins, sometimes substantially. For Australian investors, movements between the AUD and USD add another layer of exposure, since these stocks are priced and dividends paid in U.S. dollars. Companies with commercial aviation operations, like Boeing, carry additional exposure to civilian demand cycles and safety certification requirements.
Do these companies focus purely on defence, or do some serve commercial markets too?
The balance varies. Some companies here are oriented primarily toward defence and government programs, while others run substantial commercial operations alongside their military work – Boeing's commercial airplanes segment serves airlines worldwide, and General Dynamics produces business jets through its Gulfstream line. RTX sits across both, with its Collins Aerospace division supplying systems for civil as well as military aircraft. That split matters because commercial and defence revenue tend to respond differently to the same economic conditions.
More resources
✅ Top 9 drone stocks to watch in 2026→
Disclaimer
Past performance is not a reliable indicator of future performance. When you invest, your capital is at risk. You should consider your own investment objectives, financial situation, and particular needs before making an investment decision. The value of your investments can go down as well as up and you may receive back less than your original investment. As always, do your own research and consider seeking appropriate financial advice before investing.
This is not personal financial advice nor a recommendation to invest in the securities listed. Any advice provided by Stake is of general nature only and does not take into account your specific circumstances. Trading and volume data from the Stake investing platform is for reference purposes only, the investment choices of others may not be appropriate for your needs and is not a reliable indicator of performance.
Please refer to hellostake.com/pricing for the fees that apply. When you trade securities priced in another currency, currency conversion fees may apply and movements in the exchange rate may affect your returns.

Stake Desk
The freshest market insights
This article combines AI and human review from our analysts to bring you accurate, informative investing content at speed. For questions or suggestions, contact stakedesk@stake.com.au.
Subscribe
By subscribing, you agree to our Privacy Policy.