How to compare stocks before adding them to your portfolio

Stock comparison is crucial in making well-informed investment decisions. This article walks you through the different ways you can compare stocks and how financial ratios can help in doing so. Additionally, Stake has recently released its stock comparison tool to assist in your research.
How to compare two stocks?
Equipping yourself with the knowledge on how to compare stocks is crucial to allowing well-informed decision making, risk management and portfolio optimisation. While there are no black-and-whites when comparing two stocks or comparing ETFs vs stocks, a few analysis techniques have been refined over time, providing a guide on how to begin.
Financial ratios, and fundamental and technical analysis are some of the key techniques in stock analysis. As an investor, you may also look at important statistics such as the stocks' returns over a period of time and their dividend yields.
How to compare stocks using our Stock Comparison Tool
- Go to the Stock Comparison Tool
- Enter two unique shares or ETFs
- Analyse the price chart performance and other stats like price and market cap
Using the Stock Comparison Tool to compare NDQ vs IVV
How to compare stocks in the same sector?
Comparing stocks in the same sector allows for direct comparison between two similar companies.
Firstly, there’s the qualitative comparison – factors such as market share, competitive advantages, innovation, and product or service differentiation. Companies that are more successful in the long run generally have unique offerings, strong brand recognition, and the ability to adapt to evolving market conditions.
Next is the quantitative comparison – evaluating the financial performance of the two companies.
Compare metrics such as revenue, earnings, and profit margins to assess their growth rates, profitability, and efficiency. Some key numbers include revenue growth, earnings growth, profit margins, return on equity (ROE), and price-to-earnings (P/E) ratio. Some sectors may have some specific elements you need to consider; e.g. the tech industry commonly has higher P/E ratios than others due to investors factoring in growth potential. With these statistics, you may be able to decide which stock offers better value.
Stake’s comparison tool allows you to easily compare how two stocks have performed over time, see their 52-week highs and lows, and spot which one offers a higher dividend yield.
How to compare a stock to an index?
An index measures the stock market's performance or a subset of the stock market. The most used indices are the S&P 500, ASX 200 and Dow Jones. Comparing a specific stock to a broad-based index provides you with an idea of how well or poorly the stock is performing compared to the rest of the market, and also lets you know how volatile the stock is.
While Stake’s stock comparison tool does not allow for a direct comparison of a stock to a specific index, several ETFs track the performance of indices, and our comparison tool allows you to compare a singular stock with an index fund ETF.
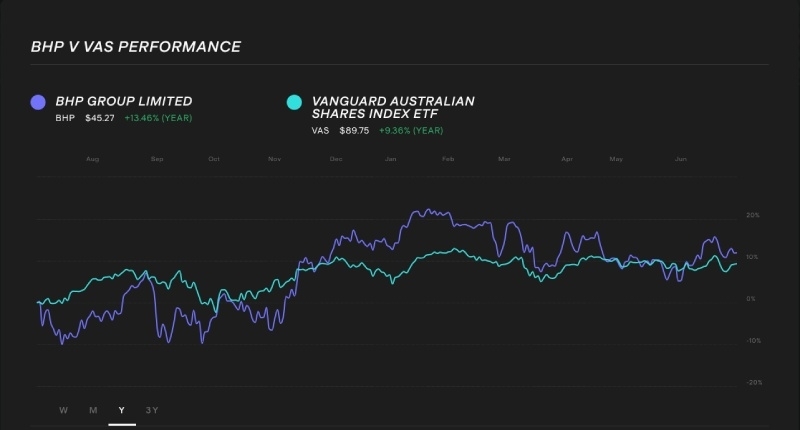
$BHP and $VAS 1-year performance compared in our Stock Comparison Tool
How to compare share prices
Share prices may not offer much insight on their own, but their value is used in almost all types of analysis. Stake’s comparison tool provides a graphical representation of the share price movements of two stocks, allowing you to toggle between the graphs of the last week, month, year and three years.
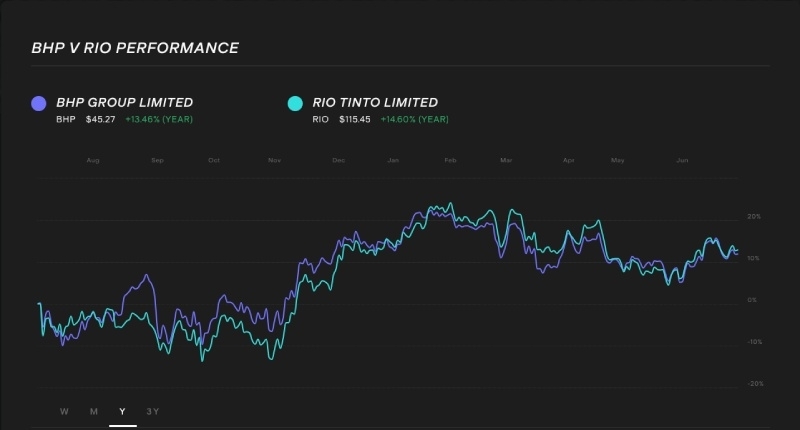
$BHP and $RIO 1-year performance compared
How to compare dividend stocks
Comparing two dividend stocks starts with looking at their dividend yields, which are calculated using the company’s annual dividend divided by its share price.
Stake’s stock comparison tool provides a company’s dividend yield as shown below.
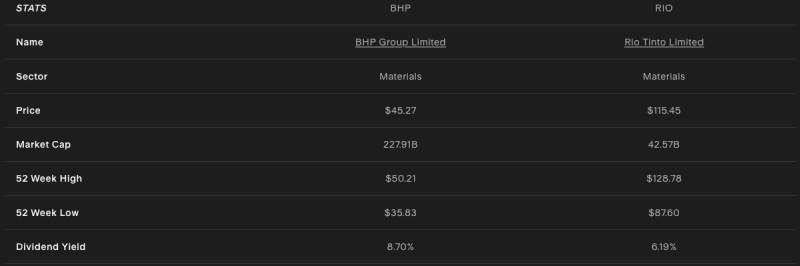
$BHP and $VAS stats including sector, price, market cap, dividend yield and 52-week high and lows.
Aside from looking at the yield, investors may also look at how consistent a company is at paying out dividends, whether or not this dividend grows or is able to grow, and how sustainable it is for the company to continue paying in the future.
💡Related: See what ASX dividend stocks are popular in 2023→
What ratios should one look to evaluate a stock?
Investing ratios are financial metrics that provide insights into various aspects of a company's financial performance, profitability, valuation, and operational efficiency. Analysts use ratios for example to determine if a stock is overvalued or undervalued, whether a business carries too much debt, or to measure how much return a company gets from its assets.
While there is a countless number of ratios, here are some of the most relevant ratios that you should compare when evaluating stocks:
Price-to-Earnings Ratio (P/E)
The P/E ratio compares a company's stock price to its earnings per share (EPS). It reflects the market's valuation of a company relative to its earnings. A higher P/E ratio suggests higher expectations for future growth, while a lower P/E ratio may indicate a potentially undervalued stock.
Price-to-Sales Ratio (P/S)
The P/S ratio compares a company's stock price to its revenue per share. It is useful for valuing companies with negative earnings or when comparing companies in different sectors. A lower P/S ratio may indicate a cheaper stock.
Return on Equity (ROE)
ROE measures the profitability generated by a company's equity investments. It compares the company's net income to its shareholder equity. A higher ROE generally indicates a more efficient and profitable company.
Debt-to-Equity Ratio
The debt-to-equity ratio compares a company's total debt to its shareholder equity. It indicates the proportion of debt financing relative to equity financing. A lower ratio suggests a more conservative capital structure.
Earnings Per Share (EPS)
EPS represents a company's net income divided by its outstanding shares. It shows how much a company earns for every outstanding share. It's a measure of profitability and is often used as a basis for calculating other ratios like the P/E ratio.
Dividend Yield
The dividend yield represents the annual dividend payment of a stock relative to its price. It indicates the return on investment through dividends. A higher dividend yield suggests a higher income return.
What are two ways to analyse stocks?
While there are no set ways of analysing stocks, research methods have narrowed down analysis techniques into two main types: fundamental analysis and technical analysis.
Fundamental analysis
Fundamental analysis is a method of evaluating stocks by examining the underlying fundamental factors that drive their value. It involves analysing a company's fundamentals: financial statements, industry trends, competitive positioning, management quality, and other qualitative and quantitative factors to assess its intrinsic value and potential for future growth.
The key components of fundamental analysis are the company's financial statements, business model, industry and peers, management team, and economic and market factors. Analysis typically begins with the broader areas (i.e. market and industry components) before narrowing down to the more specific aspects of the company (i.e. business model, management, and profitability).
The goal of fundamental analysis is to estimate the intrinsic value of a security and compare it to its market price. If the intrinsic value is higher than the market price, the stock may be considered undervalued and potentially a good investment opportunity.
However, it's important to note that fundamental analysis is subjective and requires careful interpretation of data, as well as an understanding of the company's industry and market dynamics.
Technical analysis
Technical analysis is a method of evaluating stocks by analysing historical price and volume data. It focuses on identifying patterns, trends, and indicators in a price chart to make predictions about future price movements.
There are three main underlying principles and assumptions for technical analysis: that the market discounts everything, that prices move in trends or counter-trends, and that price action is repetitive in that patterns may be spotted in price movements.
Technical analysis is more often used by active traders than investors as they require regular monitoring of price charts.
🎓 Learn more: How to research a stock→
What is the best stock comparison tool?
The Stake stock comparison tool is the perfect way to start analysing two shares or ETFs that you may be interested in. Features inside Stake Black can also help you navigate the market as an investor and make informed decisions about which stocks to buy and sell.
There are a variety of in-depth tools that can be used in conjunction with our share comparison tool to find investment opportunities.

Markets Analyst
Stella is a markets analyst and writer with almost a decade of investing experience. With a Masters in Accounting from the University of Sydney, she specialises in financial statement analysis and financial modelling. Previously, she worked as an equity analyst at Australian finance start-up, Simply Wall St, where she took charge of the market insights newsletter sent out to over a million subscribers. At Stake, Stella has been key to producing the weekly Wrap articles and social media content.
Subscribe
By subscribing, you agree to our Privacy Policy.

