What is technical analysis?

Technical analysis is a stock trading technique that uses historical price charts and trends to forecast a stock's future price movements.
Key Highlights:
- Technical analysis is often contrasted with fundamental analysis; while the former uses price charts and technical indicators to signal a buy or sell, the latter calculates a stock’s fair value using its financials and business model.
- The basic concepts of technical analysis are trends, support and resistance.
- Undertaking complete technical analysis also requires the understanding of chart patterns such as the head and shoulders pattern, and technical indicators such as moving averages.
- Technical analysis is not for everyone and its use depends on your investment style.
What is technical analysis?
Technical analysis is a form of analysis that uses a stock’s historical price and volume data in decision-making. Its concept was derived from assumptions in behavioural finance, that the irrationality in human behaviour extends to investing, and that this irrationality repeats itself over time and can be found as cyclical patterns in price charts and trends.
This form of analysis is not limited to just equities but is also used by traders in any instrument that has a market; including bonds, foreign exchange, and cryptocurrency.
Rather than long-term investors, the main users of technical analysis are active traders who buy and sell stocks on a short-term and regular basis.
Companies such as proprietary trading firms take this form of analysis a step further by using computer software to recognise buy and sell signals. This brings technical analysis much closer to algorithmic trading.
The basics of technical analysis
The two main areas of technical analysis are the movement of the stock’s price on its price chart and the technical indicators that are used to signal where the price will go next.
To introduce you to the basics of technical analysis, we’ll define a few common terms:
Price Chart: A chart detailing the historical price of a stock. Price charts can be based on any time period (e.g. day/week/month). For a price chart over a long period, the stock price recorded on the chart is generally the end-of-day (EOD) stock price.
Technical Indicator: Metrics used in technical analysis to predict future performance. There are different types of indicators, such as price-based indicators (e.g. moving averages) and sentiment indicators (e.g. CBOE Volatility Index).
Learn more: What is stock trading?
Terms used in analysing a price chart:
Trend: A long-term stock price movement in a particular direction.
Uptrend: When a stock’s price has been consistently touching higher-highs and higher-lows for a period of time.
Downtrend: Opposite direction of an uptrend.
Reversal: When a trend (either uptrend or downtrend) reverses direction and goes the opposite way.
Support: Support is a price or a price range below which a stock does not fall. The rationale behind it is that at this price, investors start buying up the stock, preventing it from falling further.
Resistance: The opposite of the Support, Resistance is the price or price range that a stock does not go above. This is the price where investors stop buying.
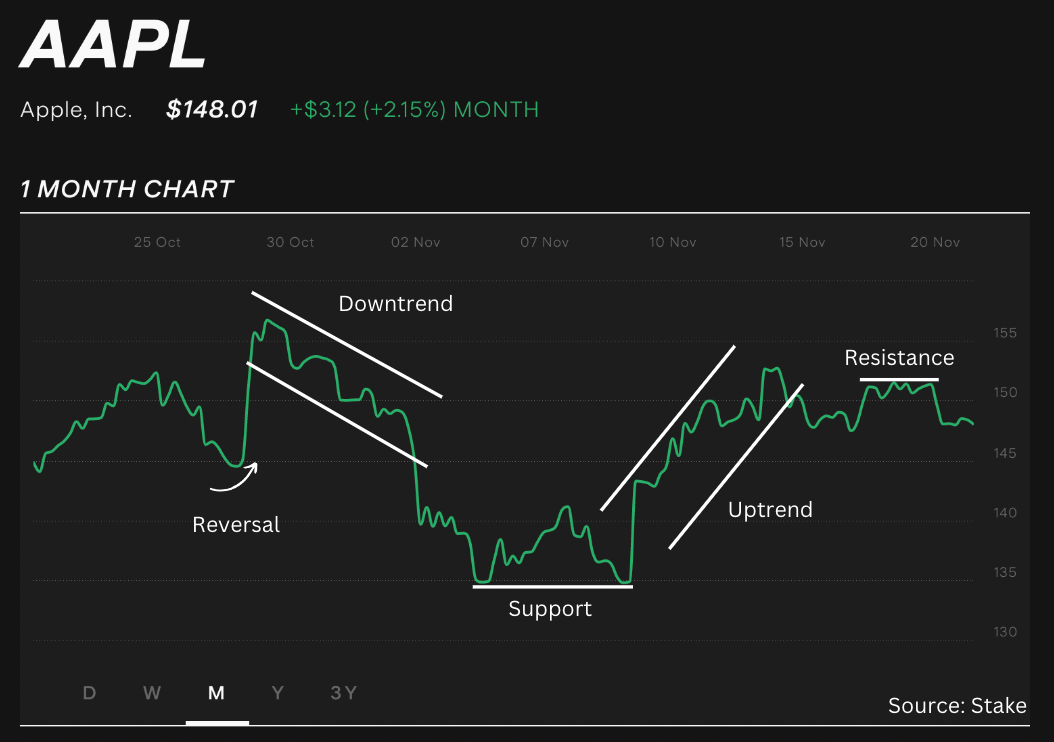
Chart Patterns and Technical Indicators
While the terms in the previous section barely scratch the surface, they comprise the building blocks of technical analysis. As you continue to learn how to research stocks, you will find higher-level analysis that involves patterns found in charts, such as triangular patterns, rectangular patterns, double and triple tops and bottoms, and head and shoulders patterns.
We present one example below:
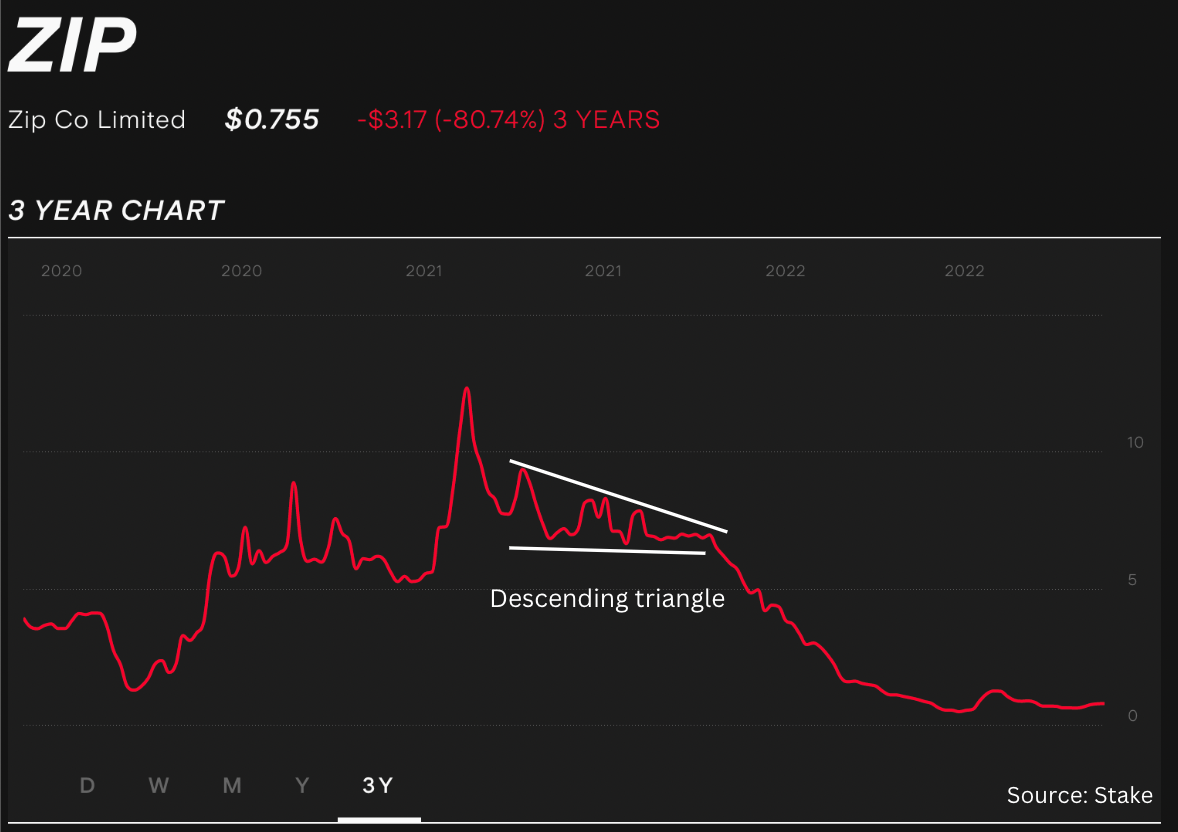
This chart shows a pattern of a descending triangle. This pattern shows that sellers have been slowly getting bearish (selling at lower prices) and demand from buyers prevents the stock from going lower than the bottom line. However, as sellers push the selling price lower every time the stock price recovers, buyer demand wanes and the stock crashes below the lower line. Having knowledge of this would tell you not to buy the stock, especially when the triangle gets really small.
Aside from chart patterns, advanced technical analysis will also get you to become familiar with terms such as moving averages, momentum oscillators, and investor sentiment. These indicators are computed mathematically and are generally based on a stock’s price and its trade volume. Their purpose is to show whether a stock price’s trend is sustainable or not.
Technical Analysis vs. Fundamental Analysis
Deciding whether to use technical analysis would naturally depend on your investing style.
As previously mentioned, technical analysis is generally used by active traders who do short-term trading, as they have the time to monitor a stock’s price movement regularly.
Long-term and passive investors would usually stick to the concepts of fundamental analysis and/or value investing. They look for companies that have strong “fundamentals” – a strong business model, financials and leadership team, for example – and are at a good value price-wise. Contrasted with technical analysis, which only requires looking at price graphs and indicators, fundamental analysis requires an in-depth understanding of a company and its value.

Markets Analyst
Stella is a markets analyst and writer with almost a decade of investing experience. With a Masters in Accounting from the University of Sydney, she specialises in financial statement analysis and financial modelling. Previously, she worked as an equity analyst at Australian finance start-up, Simply Wall St, where she took charge of the market insights newsletter sent out to over a million subscribers. At Stake, Stella has been key to producing the weekly Wrap articles and social media content.
Subscribe
By subscribing, you agree to our Privacy Policy.

