Top 10 U.S.-listed bond ETFs to watch in 2026

Bond prices generally fall when interest rates rise, so U.S. rate decisions drive how these funds behave. Maturity and credit quality determine how sharply each fund responds.
Bond ETFs pool a range of fixed-income securities – government debt, corporate bonds, or more specialised instruments – and typically distribute the interest income they collect. This list runs from ultra-short U.S. Treasury bills in State Street SPDR Bloomberg 1-3 Month T-Bill ETF ($BIL) to 20+ year Treasuries in iShares 20+ Year Treasury Bond ETF ($TLT), with Janus Henderson AAA CLO ETF ($JAAA) the only fund here built around collateralised loan obligations – securities backed by pools of corporate loans.
How we built this list: We selected these funds based on their industry or investment category and ordered them by assets under management. Prices are updated daily, and the list and supporting content are reviewed roughly every quarter. All data is sourced from Stake. This list isn't a recommendation and isn't ordered by suitability.
ETF Name | Ticker | Share Price | AUM | Expense Ratio | In Watchlists |
|---|---|---|---|---|---|
iShares Core US Aggregate Bond ETF | $95.96 | $139.42B | 0.03% | 429 | |
Vanguard Total International Bond ETF | $47.23 | $82.85B | 0.07% | 463 | |
State Street SPDR Bloomberg 1-3 Month T-Bill ETF | $91.63 | $51.15B | 0.14% | 263 | |
iShares National Muni Bond ETF | $103.43 | $52.92B | 0.05% | 31 | |
iShares 20+ Year Treasury Bond ETF | $81.34 | $47.48B | 0.15% | 2597 | |
Vanguard Short-Term Corporate Bond ETF | $77.63 | $43.86B | 0.03% | 77 | |
iShares MBS ETF | $91.29 | $35.58B | 0.04% | 37 | |
Janus Henderson AAA CLO ETF | $50.61 | $32.52B | 0.20% | 34 | |
iShares iBoxx $ Inv Grade Corporate Bond ETF | $103.85 | $29.69B | 0.14% | 260 | |
iShares Broad USD High Yield Corporate Bond ETF | $35.60 | $25.82B | 0.08% | 85 |
Past performance is not a reliable indicator of future performance.
Source: Stake market data. Figures in US$. Data updated as of 23 October 2026.
✅ Learn more: Top 10 U.S. high yield bond ETFs to watch in 2026→
1. iShares Core US Aggregate Bond ETF ($AGG)
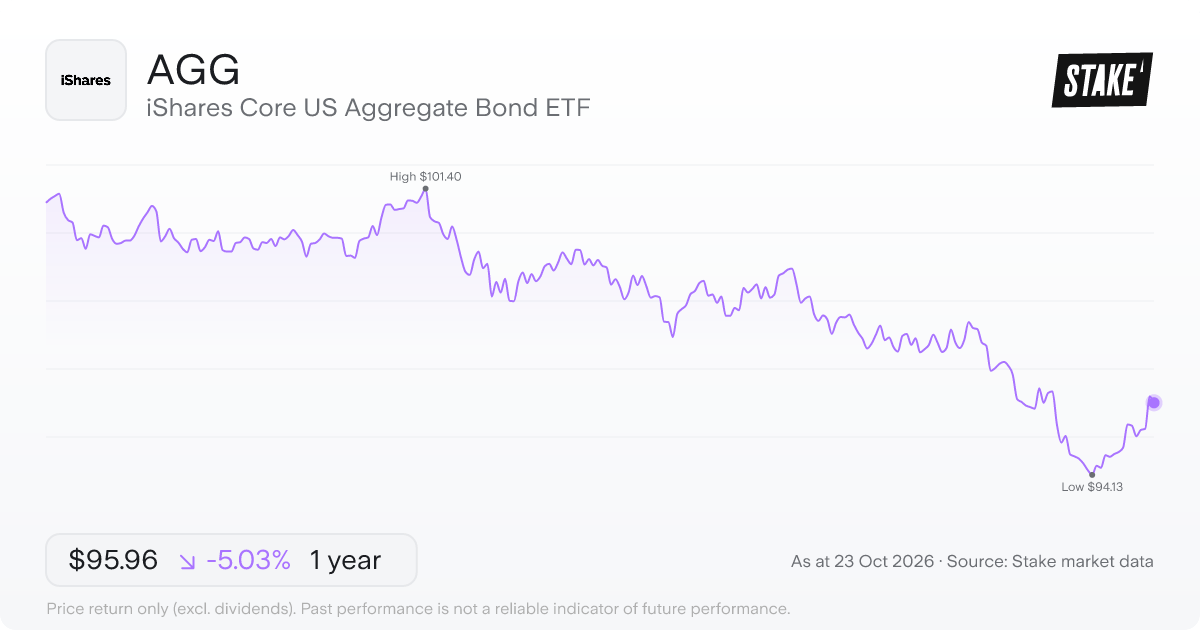
Price: US$95.96 · Daily: -0.2% · AUM: US$139.42B · MER: 0.03%
The iShares Core US Aggregate Bond ETF ($AGG) is designed to track the Bloomberg US Aggregate Bond Index, a benchmark that measures the performance of the total U.S. investment-grade bond market. The credit quality threshold is set by the index provider – bonds that fall below investment-grade aren't included. That makes $AGG a broad-based fund, built to reflect U.S. investment-grade fixed income as a whole rather than targeting a specific maturity range or bond type.
Because the underlying index is wide in scope, the fund holds U.S. fixed-income securities across the full investment-grade market. As bond ETFs of this type typically do, $AGG collects interest from its holdings and distributes that income on a periodic basis.
2. Vanguard Total International Bond ETF ($BNDX)
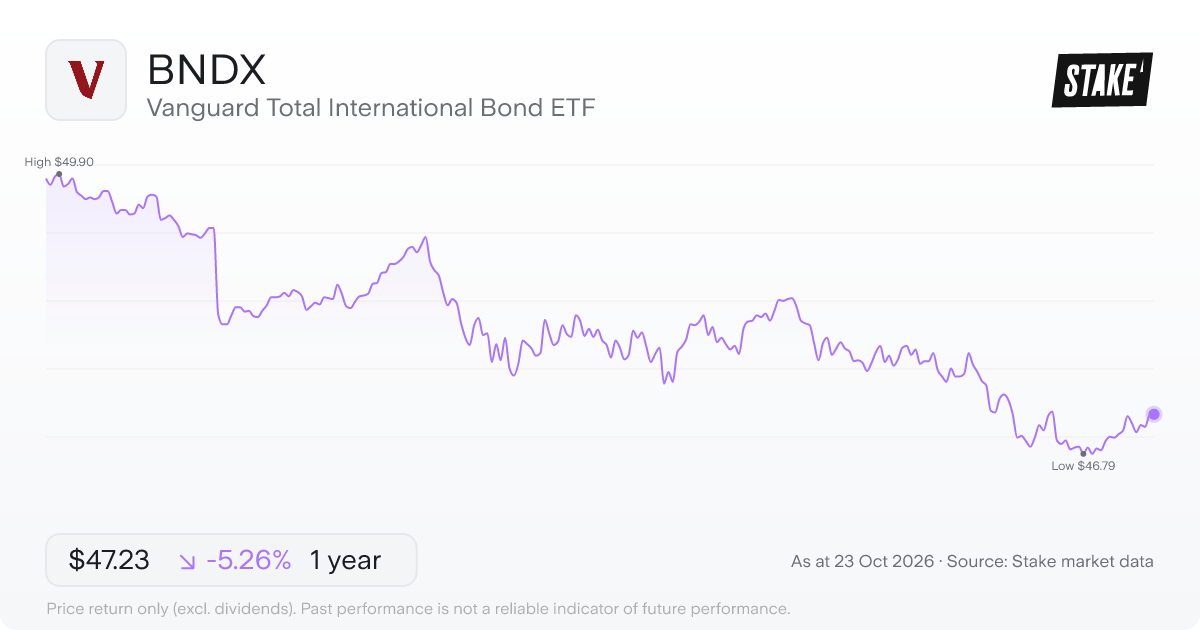
Price: US$47.23 · Daily: 0.02% · AUM: US$82.85B · MER: 0.07%
Vanguard Total International Bond ETF ($BNDX) is built around investment-grade bonds denominated in currencies other than the US dollar. It tracks the Bloomberg Global Aggregate ex-USD Float Adjusted RIC Capped Index (USD Hedged), which measures returns across non-USD fixed-income markets. The fund is currency-hedged.
$BNDX uses an indexing approach rather than active bond selection, aiming to replicate the index's composition as closely as possible. The investment-grade mandate means the fund covers bonds that meet a minimum credit rating threshold – excluding speculative-grade and high-yield debt from its scope.
3. State Street SPDR Bloomberg 1-3 Month T-Bill ETF ($BIL)
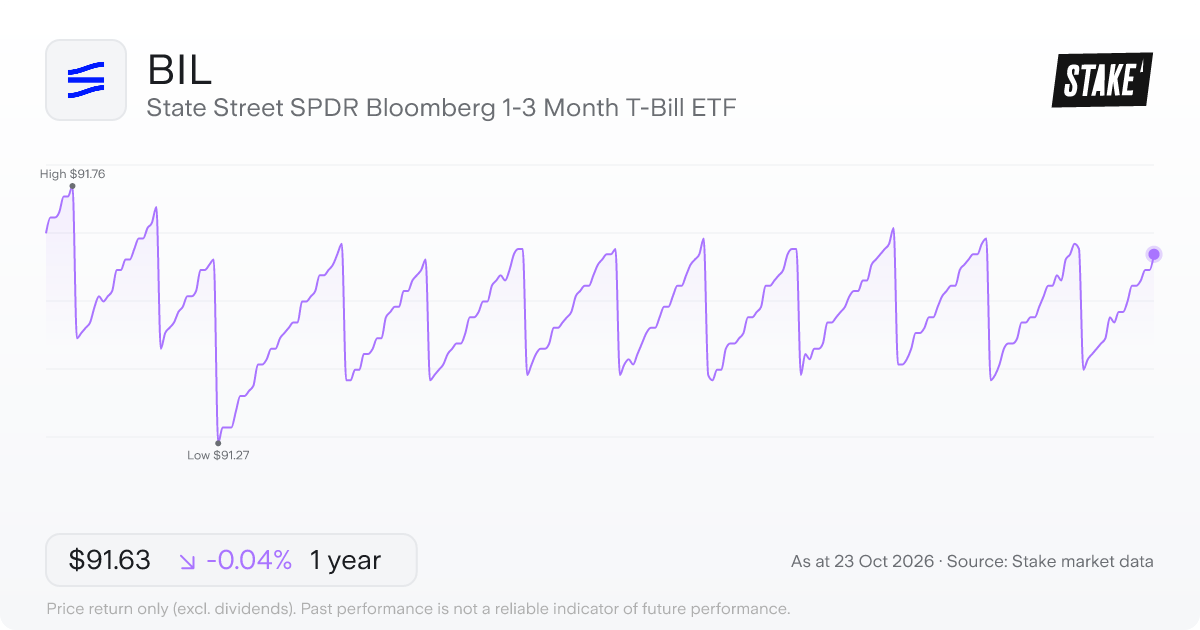
Price: US$91.63 · Daily: 0.03% · AUM: US$51.15B · MER: 0.14%
State Street SPDR Bloomberg 1-3 Month T-Bill ETF ($BIL) is built around the very short end of the U.S. government debt market. It aims to track the Bloomberg 1-3 Month US Treasury Bill Index, which covers Treasury bills maturing within one to three months.
To do that, $BIL uses a sampling approach – meaning it holds a representative selection of securities from the index rather than every bill in it. The result is a fund concentrated almost entirely on short-dated U.S. government obligations.
4. iShares National Muni Bond ETF ($MUB)
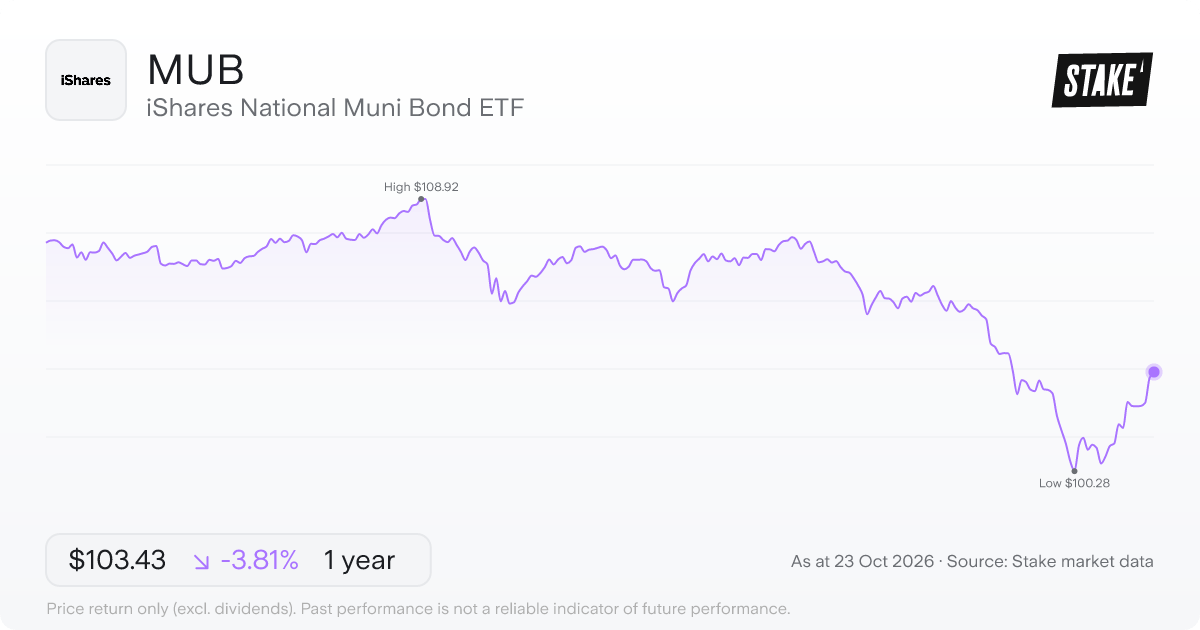
Price: US$103.43 · Daily: 0.2% · AUM: US$52.92B · MER: 0.05%
Municipal bonds – debt issued by U.S. states and their political subdivisions – are what iShares National Muni Bond ETF ($MUB) is built around. The fund is designed to track the ICE AMT-Free US National Municipal Index, which covers investment-grade, U.S. dollar denominated bonds publicly issued in the domestic U.S. market. The index is limited to bonds classified as tax-exempt under U.S. federal law. The 'AMT-Free' label means it excludes bonds subject to the Alternative Minimum Tax, a parallel tax calculation that can apply to certain types of income in the U.S.
5. iShares 20+ Year Treasury Bond ETF ($TLT)
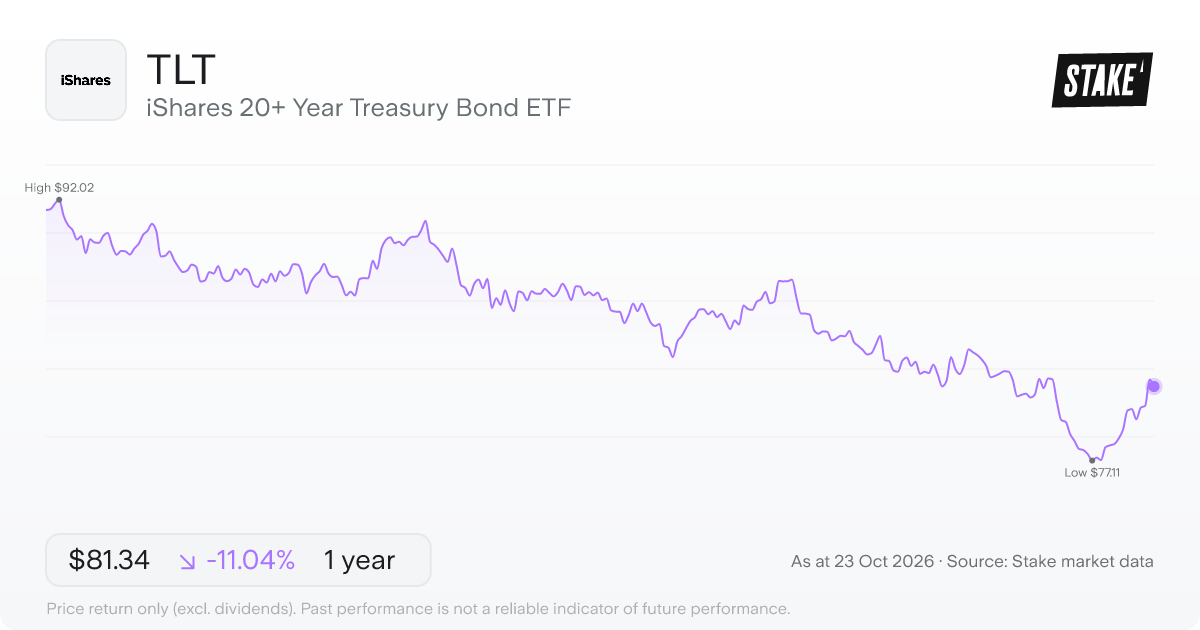
Price: US$81.34 · Daily: -0.5% · AUM: US$47.48B · MER: 0.15%
The iShares 20+ Year Treasury Bond ETF ($TLT) is built around the longest end of the U.S. government bond market. It aims to track the price and yield performance of the Barclays Capital 20+ Year Treasury Index, which covers U.S. Treasury securities with remaining maturities of at least 20 years. That means the portfolio holds bonds that are especially sensitive to changes in long-term interest rates – prices can move sharply in either direction as rate expectations shift.
6. Vanguard Short-Term Corporate Bond ETF ($VCSH)
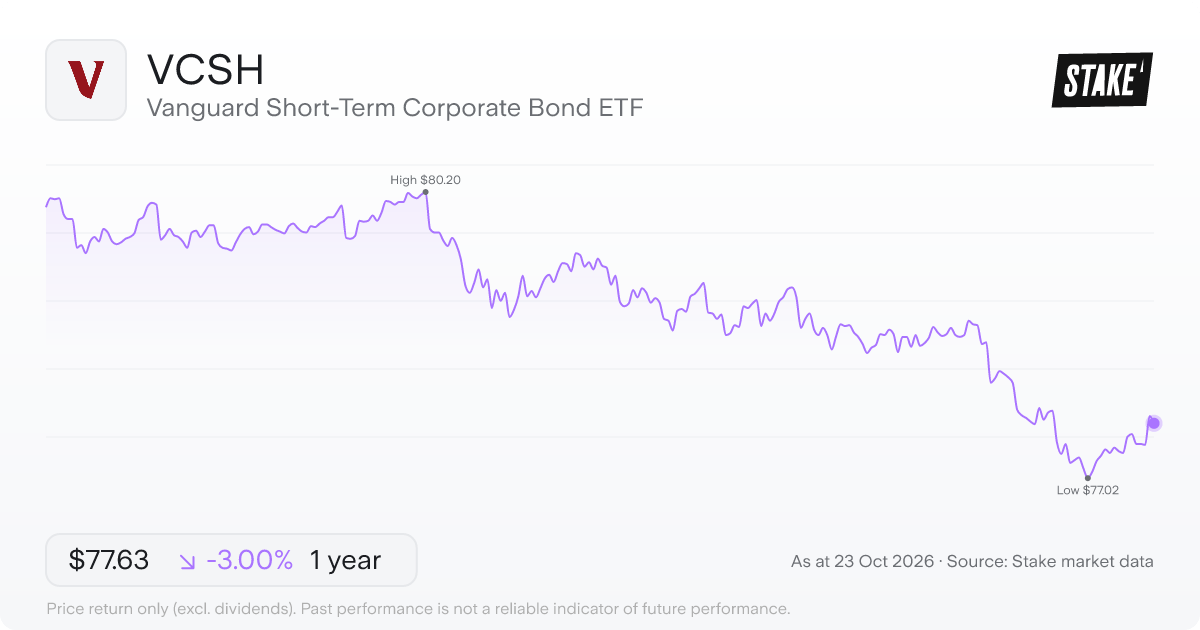
Price: US$77.63 · Daily: -0.1% · AUM: US$43.86B · MER: 0.03%
Vanguard Short-Term Corporate Bond ETF ($VCSH) is designed to track the Bloomberg U.S. 1–5 Year Corporate Bond Index, which covers investment-grade corporate bonds with maturities ranging from one to five years. The portfolio is market-weighted, so larger bond issues carry more influence on the fund's overall composition. $VCSH uses a passive indexing approach rather than active security selection, aiming to mirror the index's returns as closely as possible.
7. iShares MBS ETF ($MBB)
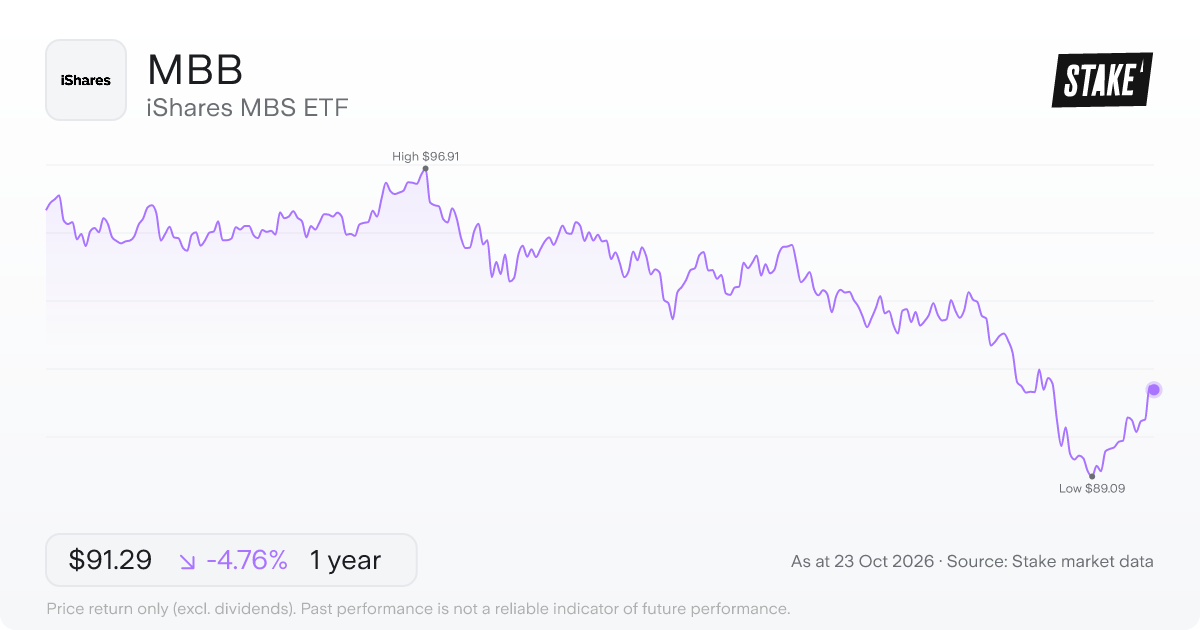
Price: US$91.29 · Daily: -0.10% · AUM: US$35.58B · MER: 0.04%
The iShares MBS ETF ($MBB) is designed to track the investment-grade agency mortgage-backed securities sector of the U.S. bond market. Mortgage-backed securities – bonds constructed from pools of residential home loans – are the underlying asset here, issued by three government-linked entities: Ginnie Mae, Freddie Mac, and Fannie Mae. The index covers fixed-rate structures with 15-, 20- and 30-year maturities, along with balloon securities, keeping the focus firmly on the long end of the mortgage market.
8. Janus Henderson AAA CLO ETF ($JAAA)
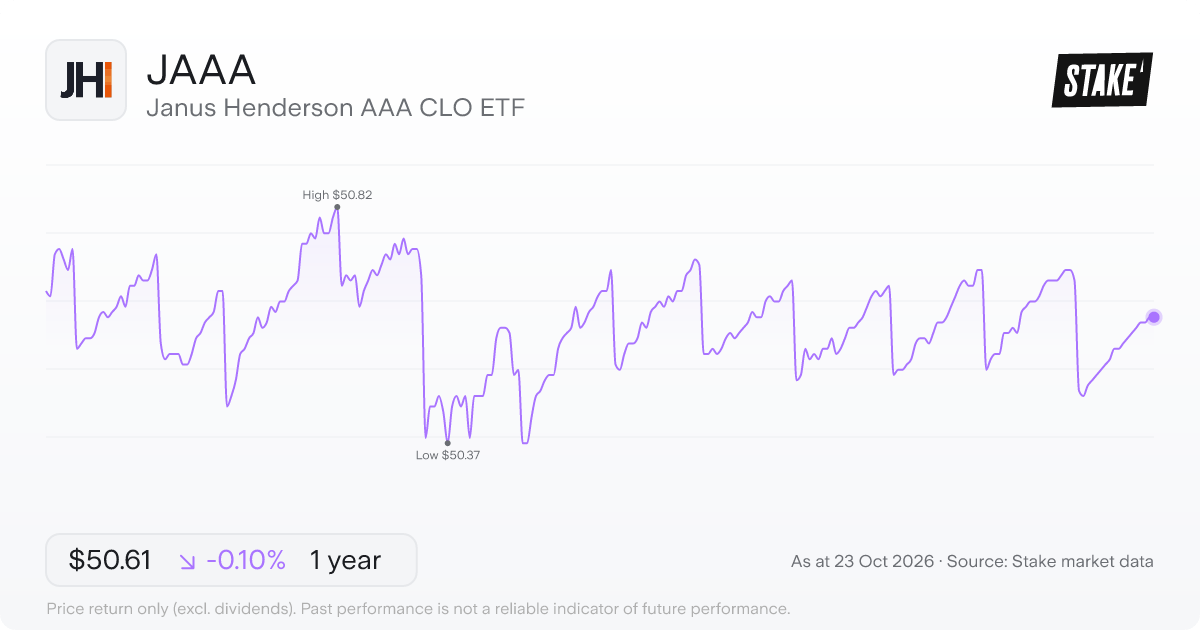
Price: US$50.61 · Daily: 0.0% · AUM: US$32.52B · MER: 0.20%
Collateralised loan obligations – structured instruments backed by pools of corporate loans – sit at the centre of what Janus Henderson AAA CLO ETF ($JAAA) does. The fund aims to hold at least 90% of its net assets in CLOs carrying a AAA credit rating, the highest tier these instruments carry. Floating-rate instruments adjust their coupons as short-term interest rates move, and $JAAA is designed to capture that kind of exposure rather than locking into fixed-rate debt. The fund's stated objectives, according to its mandate, are capital preservation and current income.
9. iShares iBoxx $ Inv Grade Corporate Bond ETF ($LQD)
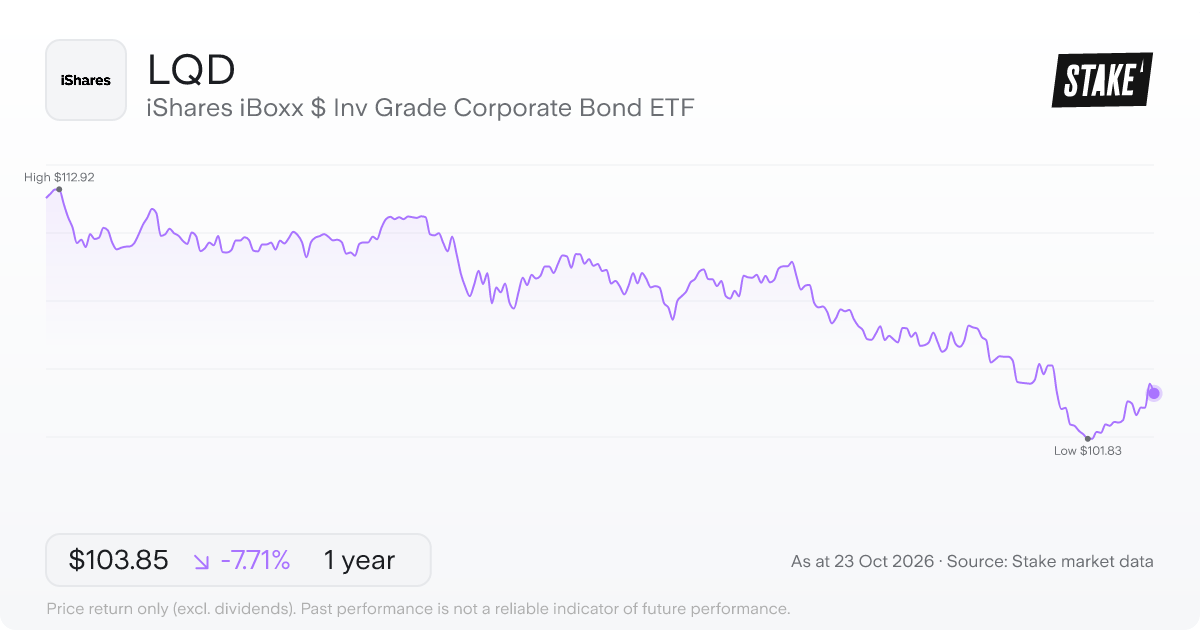
Price: US$103.85 · Daily: -0.4% · AUM: US$29.69B · MER: 0.14%
The Markit iBoxx USD Liquid Investment Grade Index is a rules-based benchmark of liquid, US dollar-denominated corporate bonds. iShares iBoxx $ Inv Grade Corporate Bond ETF ($LQD) is designed to track it. Every bond in the index carries an investment-grade credit rating, placing issuers above speculative-grade on the major rating scales. The fund aims to hold at least 90% of its assets in the index's component securities, with at least 95% in corporate bonds.
The portfolio holds debt issued by companies rather than governments. Bond prices can move with interest rate changes, so the fund's value may shift even when the underlying bonds maintain their investment-grade status.
10. iShares Broad USD High Yield Corporate Bond ETF ($USHY)
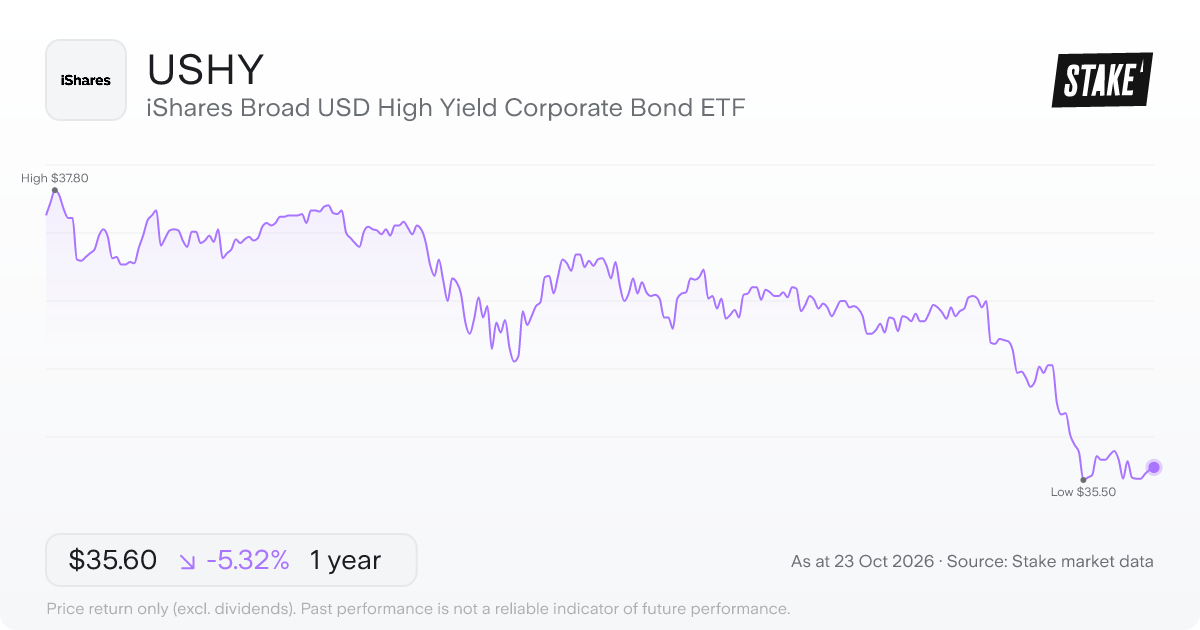
Price: US$35.60 · Daily: 0.06% · AUM: US$25.82B · MER: 0.08%
Tracking the BofA Merrill Lynch U.S. High Yield Constrained Index, the iShares Broad USD High Yield Corporate Bond ETF ($USHY) covers the below-investment-grade segment of the U.S. corporate bond market. The index holds dollar-denominated bonds issued for sale in the U.S. by companies whose credit ratings place them in the high yield category. $USHY aims to keep at least 90% of its assets in the index's component securities.
High yield bonds – often called junk bonds – carry lower credit ratings than investment-grade corporate or government debt. That lower rating reflects a higher assessed likelihood of default from the issuing companies. Credit risk is the defining characteristic of this segment of the fixed-income market.
➡️ Top 10 U.S.-listed index funds to watch in 2026→
Common questions
How do I invest in U.S.-listed bond ETFs in Australia?
All the funds in this list trade on U.S. exchanges, so you'll need a share trading platform that provides U.S. market access. Once your account is set up, you can search by ticker and buy or sell during U.S. trading hours, just as you would with any U.S.-listed share.
What are the key risks of U.S.-listed bond ETFs?
Some of the key risks include interest rate sensitivity, credit risk and currency exposure. Bond prices generally move in the opposite direction to interest rates – longer-duration funds are more sensitive to rate changes than shorter-term ones. Corporate bond funds carry the risk that issuers could default; that risk is higher for below-investment-grade bonds than for investment-grade ones. Because all these funds are priced in USD, movements in the AUD/USD rate affect what you pay to buy in and what your proceeds are worth in Australian dollars.
How do the bond types in this list differ?
The funds here cover several distinct segments of the bond market, varying by issuer type, maturity and credit quality. Treasury funds hold U.S. government debt – $BIL at the very short end (1–3 months) and $TLT at the long end (20+ years). Investment-grade corporate funds like $LQD and $VCSH hold company-issued debt, while $USHY targets bonds rated below investment grade. $MUB holds tax-exempt debt from U.S. state and local governments, $MBB focuses on U.S. agency mortgage-backed securities, and $JAAA invests in AAA-rated collateralised loan obligations (CLOs) – a type of structured credit instrument backed by pools of loans. $AGG covers the broad U.S. investment-grade bond market across multiple issuer types. $BNDX takes a different approach, holding non-USD investment-grade bonds from outside the U.S., with that currency exposure hedged back to USD within the fund.
More resources
✅ Top 10 ASX bond ETFs to watch in 2026→
Disclaimer
Past performance is not a reliable indicator of future performance. When you invest, your capital is at risk. You should consider your own investment objectives, financial situation, and particular needs before making an investment decision. The value of your investments can go down as well as up and you may receive back less than your original investment. As always, do your own research and consider seeking appropriate financial advice before investing.
This is not personal financial advice nor a recommendation to invest in the securities listed. Any advice provided by Stake is of general nature only and does not take into account your specific circumstances. Trading and volume data from the Stake investing platform is for reference purposes only, the investment choices of others may not be appropriate for your needs and is not a reliable indicator of performance.
Please refer to hellostake.com/pricing for the fees that apply. When you trade securities priced in another currency, currency conversion fees may apply and movements in the exchange rate may affect your returns.

Stake Desk
The freshest market insights
This article combines AI and human review from our analysts to bring you accurate, informative investing content at speed. For questions or suggestions, contact stakedesk@stake.com.au.
Subscribe
By subscribing, you agree to our Privacy Policy.