How to read a balance sheet and analyse companies
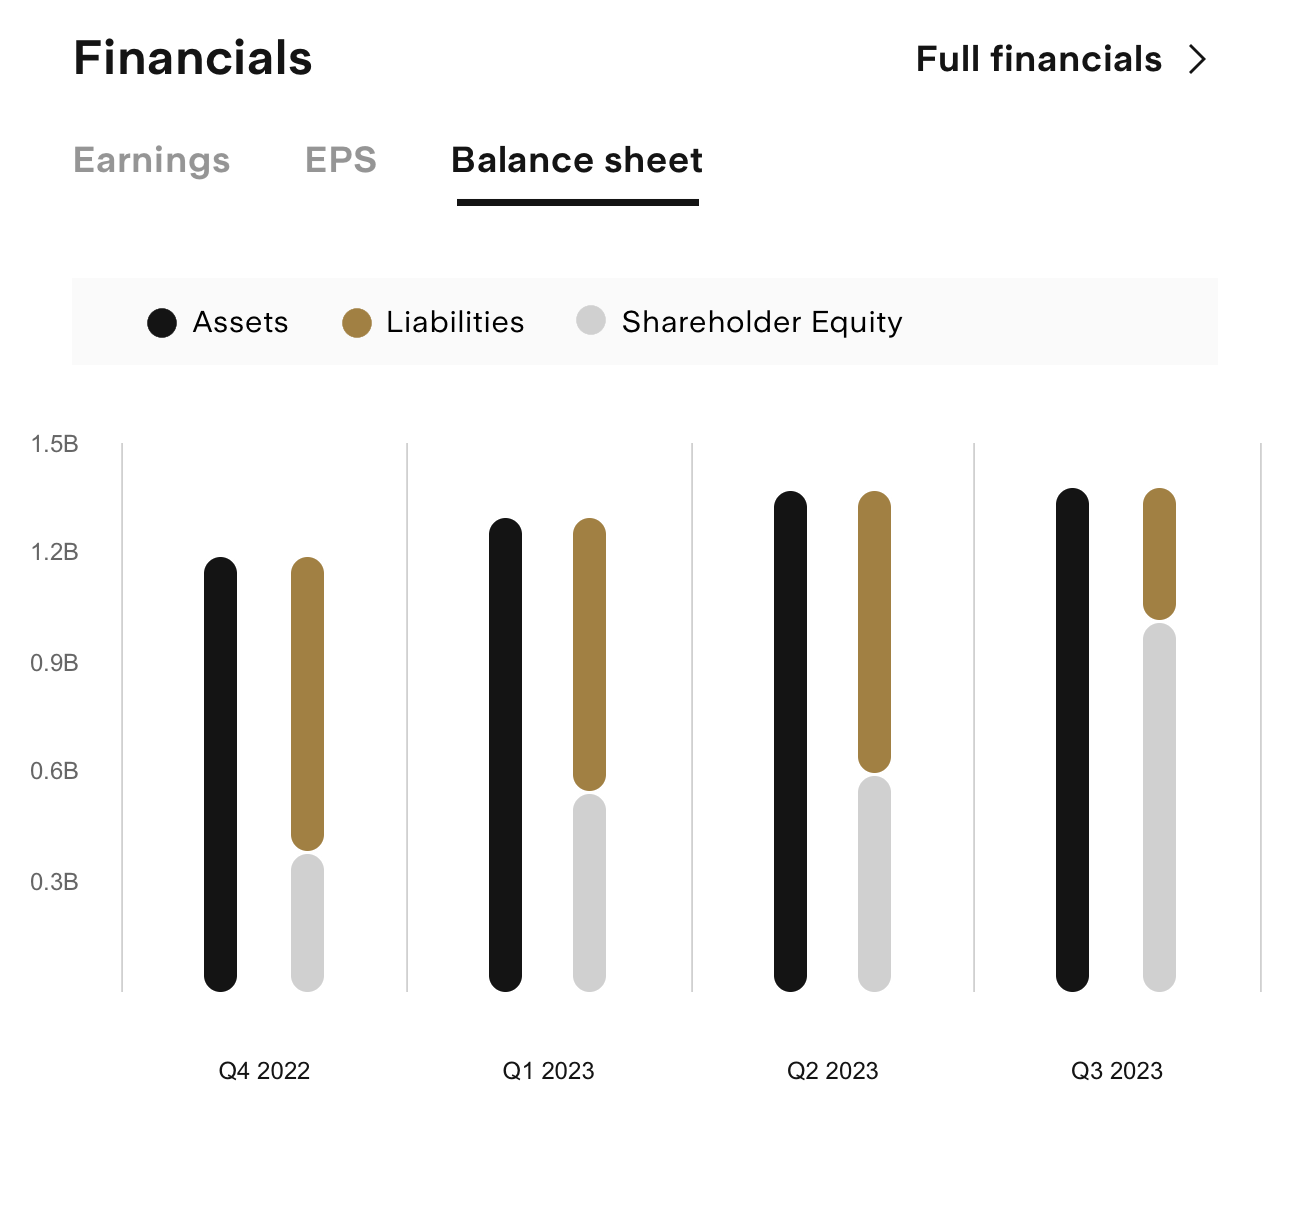
The balance sheet contains important information about a company’s financial position. It can reveal what the company owns, in terms of assets, liabilities and equity.
What is a balance sheet?
Together with a cash flow statement and income statement, a company’s balance sheet is a key financial statement and can provide insight into its financial condition. The aptly named document is divided into two parts, which must be equal or 'balance' each other out based on a formula.
This equation is: Assets = Liabilities + Equity
The measure can also be rearranged into:
Equity = Assets - Liabilities or Liabilities = Assets - Equity
This information can be used to assess the business' ability to cover its debts and pay out distributions to investors. A firm can also use this data internally as guidance to see if strategies are succeeding or whether a pivot to new opportunities is possible.
The balance sheet gives the 'book value' of what a firm is worth at a specific date, as a snapshot, and is normally part of quarterly reporting requirements for public companies. External auditors could also use the document to check if a firm is in line with reporting laws.
Elements of a balance sheet
A company uses assets to fund operations, while liabilities and equity are two sources of support for assets. A company’s assets include anything it owns that has a value. They usually have a quantifiable value and can be converted into cash if needed. Assets are generally divided into current and non-current assets.
Current assets are considered to be liquid and include those the business is expected to turn into cash within one year. A few examples are cash, accounts receivable and inventory.
Cash equivalents are low-risk investments that could quickly be changed into cash, such as U.S. Treasury bills.
Non-current assets usually have a lifespan of longer than one year, not coming with the expectation of being exchanged for cash during that time or their nature making the rapid conversion more difficult. The category can cover items such as land and equipment, as well as intangible assets that can’t be physically touched like patents and brands.
While assets are typically a positive on a balance sheet, liabilities represent negatives as things the business owes to a debtor. They’re also separated into current and non-current groups.
Current liabilities refer to any of them due within one year and covering areas such as payroll, rent, accounts payable and various other kinds of bills.
The company expects the obligations for non-current liabilities to be due further than one year into the future. These could be payments for leases, loans, bonds and deferred tax liabilities.
Adding up all the assets and then subtracting all the liabilities should provide the equity component, which can be referred to as either owner’s equity or shareholders’ equity. This category usually includes the retained earnings generated by the business over time and investment by shareholders.

How to read a balance sheet?
Assets are usually found on the top or left side of a balance sheet, while liabilities are either below or beside them depending on the set-up of the balance sheet. Within these sections, the items are organised by current and non-current categories.
Assets are generally ordered by most to least liquid, reflecting how readily they could be used as cash by the business. Liabilities tend to be classified from short to long-term obligations, showing how urgently they need to be repaid.
The equity represents the approximate amount received by shareholders if the company were to be liquidated at the specified date. This figure is different to the market capitalisation, which is the value of its outstanding shares in the stock market and tends to be a less volatile measure.
Investors should not only look at a balance sheet before making an investment decision. A business might add notes explaining certain numbers and provide explanations about why items were put in precise categories. Viewing several years of balance sheets could also help with understanding how a firm is depreciating its assets.
🎓 Learn more: Follow these 7 steps to learn how to research stocks→
Analyse a company using balance sheet ratios
The information in a balance sheet can be used to determine several financial ratios.
Current Ratio
The Current Ratio can give an idea about whether the company can pay its bills in the short term with the amount of cash it has using the formula:
Current Ratio = Current Assets ÷ Current Liabilities
The business might come under financial pressure if the ratio is less than one, but accumulating large amounts of cash without a plan can also raise questions.
Quick Ratio
As inventories can't always be sold at their expected value and are often marked down in this situation, the Quick Ratio can be seen as a more conservative measure of liquidity using the formula:
Quick Ratio = (Current Assets - Inventories) ÷ Current Liabilities
Debit-to-Equity Ratio
The degree to which a firm is dependent on debt is shown by the Debt-to-Equity Ratio below. Lower numbers are generally preferable, but a ratio of zero might not always be desirable and might lead to inefficient flows of funds through a business in some cases.
Debt-to-Equity Ratio = Total Liabilities ÷ Equity
Working Capital
The difference between a company's current assets and liabilities is known as the working capital. Positive measures are generally favourable, but having large amounts of inventory isn't always a plus. The averages for this measure also depend on the industry and the amount of bargaining power of a firm.
Working Capital = Current Assets - Current Liabilities
Inventory Turnover Ratio
To see how efficiently a business uses its resources, measures such as the Inventory Turnover Ratio can be used. This reveals how quickly a company's goods are sold to customers. However, a high turnover without strong sales numbers should also raise questions.
Inventory Turnover Ratio = Cost of Goods Sold ÷ Average Inventory
Asset Turnover Ratio
The same concept can be applied to a firm's assets with the Asset Turnover Ratio. Investors should consider that assets can command large sale or purchase prices, which could affect this ratio.
Asset Turnover Ratio = Net Sales ÷ Average Total Assets
Return on Assets
In terms of profitability, a high Return on Assets ratio can reveal that a firm is making good use of its assets.
Return on Assets = Net Income ÷ Total Assets
Return on Equity
Higher numbers are also viewed positively when comparing a company's profits to the equity held by its shareholders, as shown by the Return on Equity equation.
Return on Equity = Net Income ÷ Equity
🎓 Learn more: What is a good P/E ratio for a stock?→
Balance sheet analysis example using Stake Black
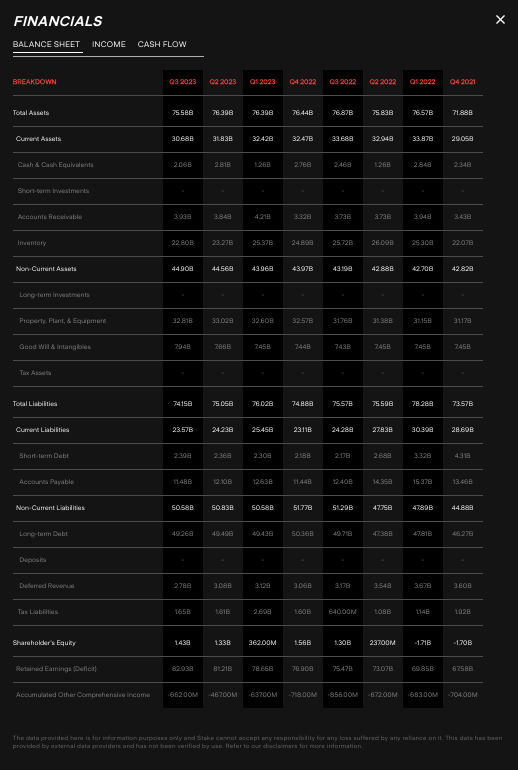
The balance for Home Depot ($HD) is below.

The Current Ratio for Q3 2023 could be found as: 1.31 = US$30.68b ÷ US$23.57b
This measure stayed relatively stable when compared to Q2 2023: 1.30 = US$31.83bn ÷ US$24.23b
The Working Capital for Q3 2023 could be found as: US$7.11b = US$30.68b - US$23.57b
This is slightly lower than the Q2 2023 figure of: US$7.11b = US$31.83bn - US$24.23b
What is the purpose of a balance sheet?
A balance sheet gives details about a company’s capital structure, liabilities, assets and investments. The document provides investors and business management with insights about the firm’s financial position, especially about its ability to pay ongoing expenses.
Public companies must publish financial statements that meet accounting standards at regular intervals, usually quarterly. The balance sheet is one of these files that brings transparency to investors and reduces the chances of fraudulent activities occurring in a business.
More resources:
✅ How to know if a stock is over or undervalued?→
✅ 10 Long term investing tips to remember→
✅ How to buy shares in Australia→
Balance sheets FAQs
A balance sheet is an important source of information available to investors about the financial condition of a publicly traded company - showing what the company owns and its financial obligations. The data in the document can be used in formulas used in fundamental analysis that provide insights into how efficiently a business operates, its profitability levels and the risk of it being unable to pay debts.
Looking at balance sheets for several time periods can give an indication of whether a firm’s strategies are translating into financial performance. The equity figure in a balance sheet is not the same as a company’s market value, but the information contained in the file can affect its share price and is used by analysts to make buy or sell recommendations.
Looking at a company’s cash, short-term investments, equipment, accounts receivable, property and major liabilities can supply insights about its operations. A balance sheet is often used to determine the likelihood of a firm being unable to pay its debts and whether its finances are stable enough to allow it to expand its operations.
Comparative balance sheets allow investors to see changes in the company’s financial health over time by having data for two or more periods.
Vertical balance sheets put the businesses’ assets, liabilities and equity in one vertical column, rather than the usual two. This can give an understanding of the firm’s overall financial structure and the relative importance of the three categories.
In contrast, a horizontal balance sheet lists these three segments side by side in a horizontal row and is often used for seeing the differences between two time periods.
Companies listed in the U.S. tend to use the report format, which puts assets first, then liabilities and equity in third place.
A profit and loss (P&L) statement gives an overview of the revenues, costs and various expenses of a company over a period of time. The main aim of the P&L statement is to help determine whether a firm is profitable or not by showing net income. A balance sheet gives a snapshot of a businesses’ assets, liabilities and equity at a particular point in time.

Megan is a markets analyst at Stake, with 7 years of experience in the world of investing and a Master’s degree in Business and Economics from The University of Sydney Business School. Megan has extensive knowledge of the UK markets, working as an analyst at ARCH Emerging Markets - a UK investment advisory platform focused on private equity. Previously she also worked as an analyst at Australian robo advisor Stockspot, where she researched ASX listed equities and helped construct the company's portfolios.


