
Top 10 SaaS stocks to watch in 2026

When a bank sends you an authentication code, a subscription platform is usually behind it. These companies build that software for businesses rather than for consumers.
Software as a service – SaaS – means selling cloud-based software on a subscription, so customers pay a recurring fee instead of a one-off licence. The ten stocks in this article cover quite different parts of that landscape: ServiceNow ($NOW) automates enterprise workflows, Toast ($TOST) runs digital operations for restaurants, and GitLab ($GTLB) manages the full software development and security lifecycle.
How we built this list: We selected these companies based on their industry and ordered them by market capitalisation. Prices are updated daily, and the list and supporting content are reviewed roughly every quarter. All data is sourced from Stake. This list isn't a recommendation and isn't ordered by suitability.
Company Name | Ticker | Share Price | Market Cap | In Watchlists |
|---|---|---|---|---|
ServiceNow | $148.57 | $144.72B | 7862 | |
Datadog NV | $266.25 | $96.71B | 3573 | |
Atlassian US | $217.12 | $51.81B | 10467 | |
Workday | $196.63 | $45.49B | 1552 | |
Twilio | $273.40 | $41.64B | 5017 | |
Zoom Commns | $98.51 | $27.56B | 9476 | |
Toast | $32.22 | $17.25B | 605 | |
HubSpot | $238.91 | $11.28B | 1553 | |
Paycom Software | $252.87 | $10.77B | 892 | |
GitLab | $55.94 | $8.86B | 1053 |
Past performance is not a reliable indicator of future performance.
Source: Stake market data. Figures in US$. Data updated as of 15 October 2026.
✅ Learn more: Top 7 ASX AI stocks to watch in 2026→
Sign up in minutes and get access to a CHESS-sponsored platform, where you can explore SaaS stocks and more.
1. ServiceNow ($NOW)
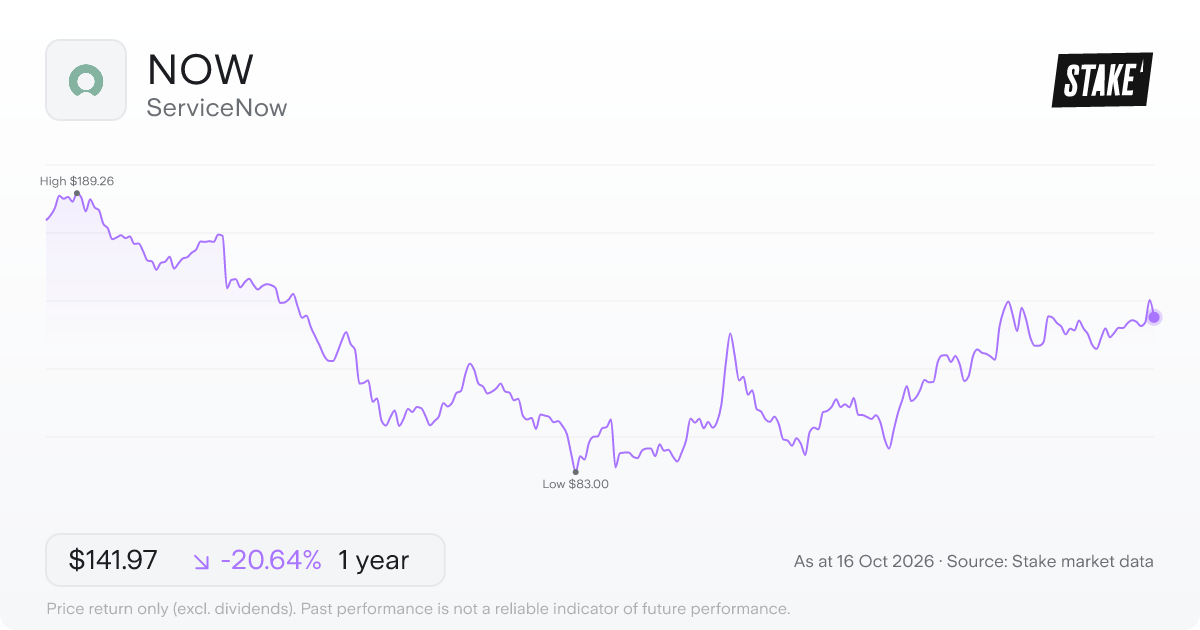
Price: US$148.57 · Daily: 6.1% · Market cap: US$144.72B · Sector: Technology · Industry: Software & IT
ServiceNow ($NOW) sells cloud-based software that helps large organisations digitise the way work moves through them. The Now Platform connects people, processes, data and devices into one system, covering IT service management, HR delivery and customer operations across both public and private sector organisations.
Its workflow applications are grouped into four areas: Technology, CRM and Industry, Core Business and Creator. AI runs through much of the product suite – tools like ServiceNow AI Agents and AI Control Tower aim to automate and orchestrate tasks within those workflows.
Bill McDermott leads a team of 29,187 people. $NOW also offers identity security products, helping organisations manage access across their enterprise systems.
2. Datadog NV ($DDOG)
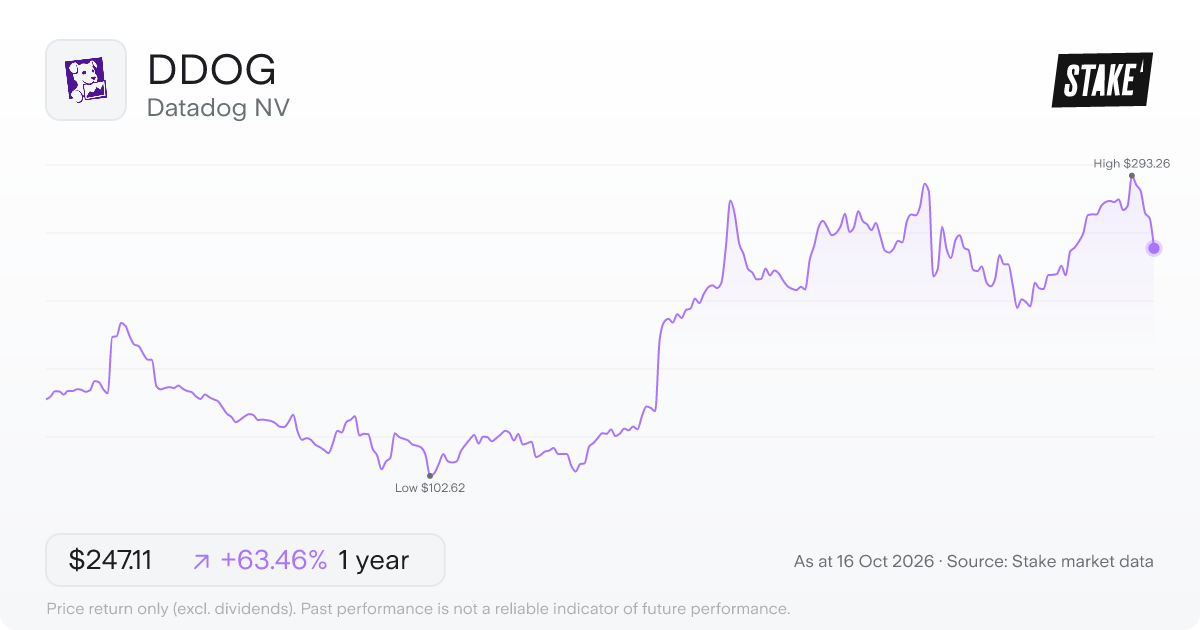
Price: US$266.25 · Daily: -1.1% · Market cap: US$96.71B · Sector: Technology · Industry: Software & IT
Monitoring a cloud application means watching dozens of signals at once – server performance, error rates, security events, user sessions. Datadog NV ($DDOG) builds a platform designed to pull all of that into a single view, connecting through a single agent and more than 1,000 integrations.
The platform covers infrastructure monitoring, application performance, log management and cloud security. The company describes it as cloud-agnostic, meaning it's designed to work across different cloud environments rather than being tied to one provider. Under CEO Olivier Pomel, $DDOG employs 8,100 people. Development, security and operations teams can all draw on the same data layer, rather than switching between separate tools for each function.
3. Atlassian US ($TEAM)
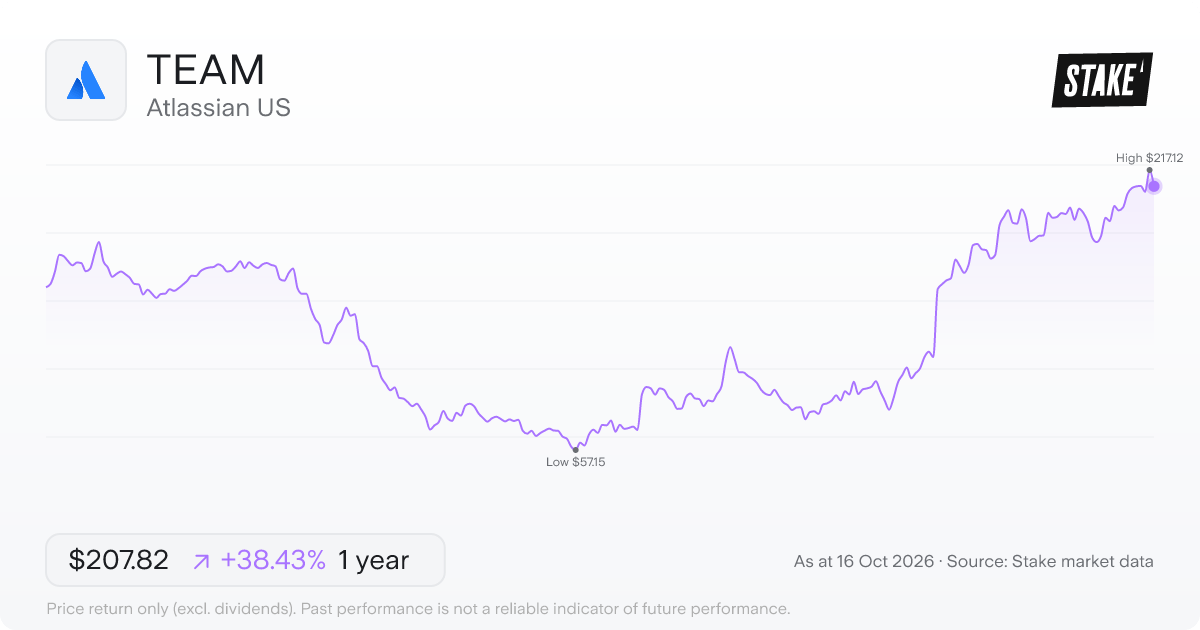
Price: US$217.12 · Daily: 6.1% · Market cap: US$51.81B · Sector: Technology · Industry: Software & IT
Atlassian Corporation ($TEAM) makes software for software development teams, IT operations and broader business workflows. Products like Jira, Confluence, Loom and Jira Service Management all run on a shared cloud platform designed to connect teams, data and processes across an organisation.
$TEAM has layered AI into the mix through Rovo, an agent layer intended to surface information and automate tasks within the existing app portfolio. Under chief executive Mike Cannon Brookes, the company employs 13,301 people.
4. Workday ($WDAY)
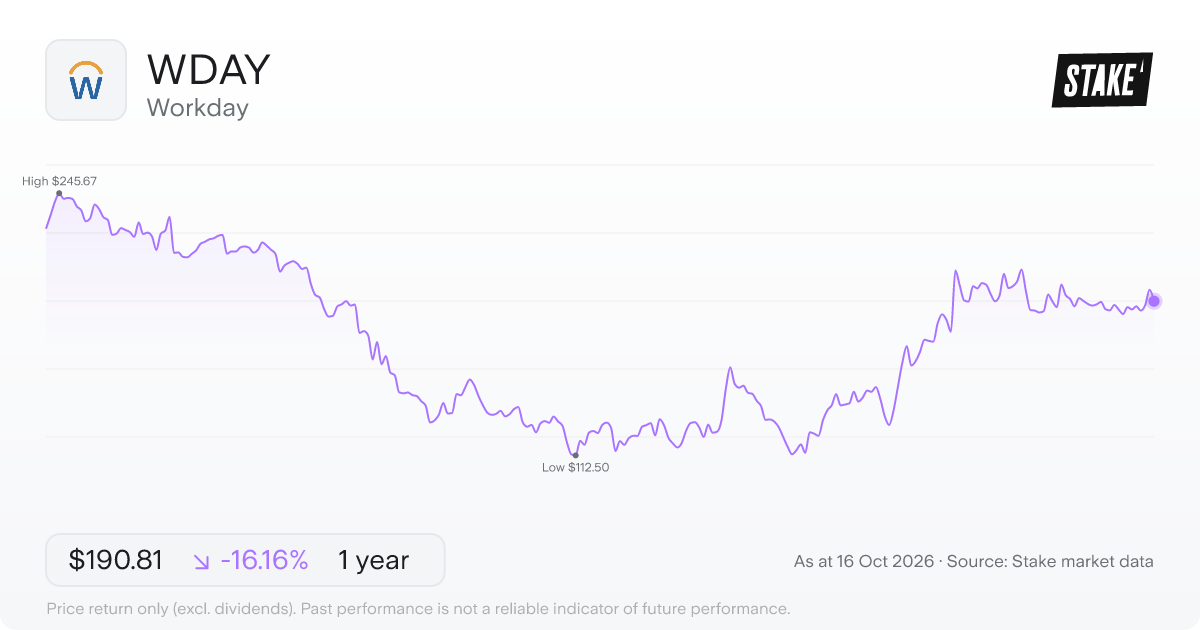
Price: US$196.63 · Daily: 4.2% · Market cap: US$45.49B · Sector: Technology · Industry: Software & IT
Workday ($WDAY) builds cloud software that helps large organisations manage two of their biggest functions: their people and their finances. The platform is designed to be open and configurable, so organisations can connect it to other tools or use Workday Build to create their own AI-powered applications on top of it.
The company serves a wide spread of industries – from healthcare and higher education to manufacturing, retail and government – with Aneel Bhusri at the helm and around 21,000 employees behind the product. Its AI layer is embedded across the platform rather than offered as a separate add-on, aimed at automating decisions around workforce management and spending.
5. Twilio ($TWLO)
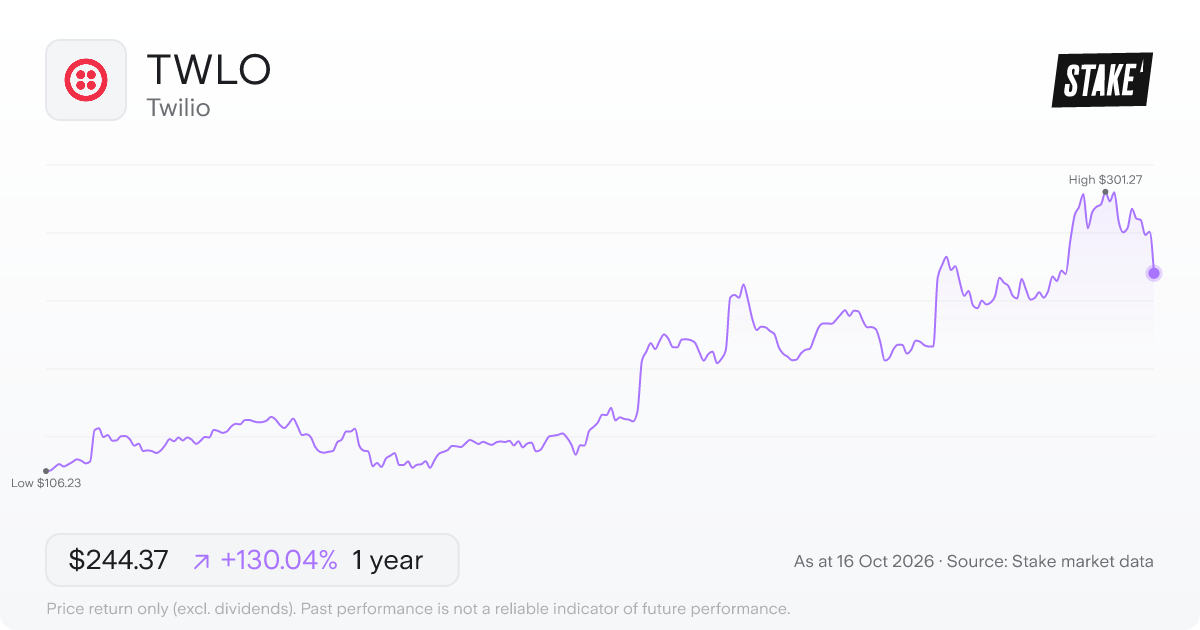
Price: US$273.40 · Daily: 0.8% · Market cap: US$41.64B · Sector: Technology · Industry: Software & IT
Twilio ($TWLO) sits behind a lot of the digital communication you interact with daily – the text message confirming your delivery, the two-factor authentication code, the automated voice call from your bank. Its Communications segment gives developers a set of APIs (application programming interfaces) to build messaging, voice, email, and identity verification directly into their software, without building that infrastructure from scratch.
The second piece is Twilio Segment, a customer data platform that pulls together real-time behavioural data from across a customer's journey into a single profile. Businesses use that unified view to personalise how they communicate through the Communications tools. Under CEO Khozema Shipchandler, the company employs around 5,587 people worldwide.
Join 1M+ on Stake
Effortless investing in U.S. shares & ETFs
6. Zoom Commns ($ZM)
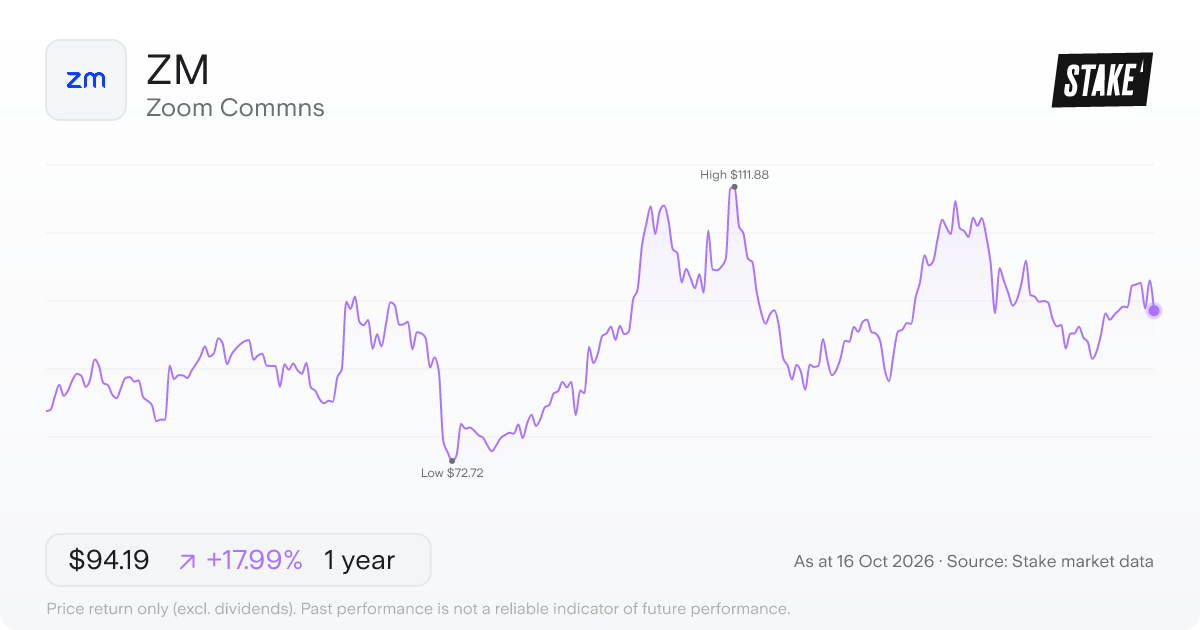
Price: US$98.51 · Daily: 4.3% · Market cap: US$27.56B · Sector: Technology · Industry: Software & IT
Zoom Communications ($ZM) has moved well beyond the video meetings it became known for, building out Zoom Workplace as an AI-powered platform that ties together calls, chat, phone, a contact centre, docs, whiteboards and calendar into one connected environment. The AI layer, called Zoom AI Companion, is embedded across these tools rather than sitting as a separate product.
The company says $ZM serves customers across education, financial services, government, retail, manufacturing and healthcare – a spread that keeps it anchored in enterprise relationships rather than any single vertical. Under CEO Eric Yuan, the 7,438-person team continues to expand the platform's scope, with workspace reservation and visitor management tools taking it beyond software and into how offices physically operate.
7. Toast ($TOST)
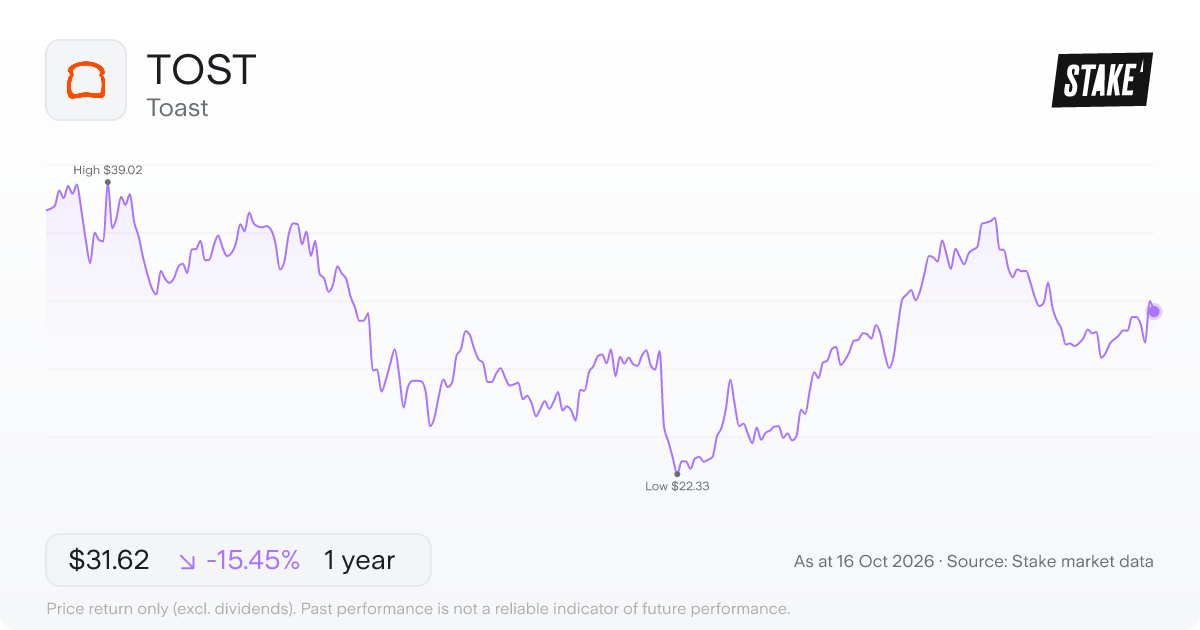
Price: US$32.22 · Daily: 7.9% · Market cap: US$17.25B · Sector: Technology · Industry: Software & IT
Running a restaurant means managing payments, orders, staff, and delivery all at once – and Toast, Inc. ($TOST) is built to handle that in a single system. The platform connects front-of-house and back-of-house operations across service models including dine-in, takeout, catering, and delivery. On top of point-of-sale and payment processing, $TOST offers marketing tools like loyalty programmes, gift cards, and targeted SMS and email campaigns. CEO Aman Narang leads around 6,500 people, and a network of third-party partners extends what the platform can do.
8. HubSpot ($HUBS)
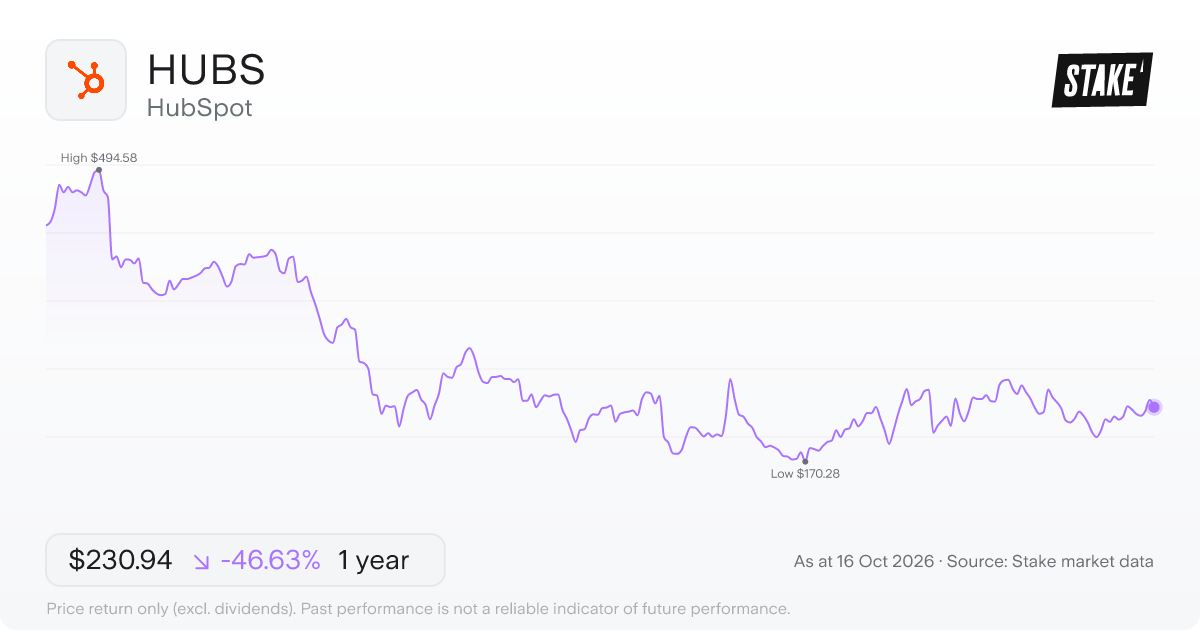
Price: US$238.91 · Daily: 5.6% · Market cap: US$11.28B · Sector: Technology · Industry: Software & IT
HubSpot ($HUBS) builds what it calls a customer platform – a connected suite of tools covering marketing, sales, customer service, content, operations and commerce. At the centre is a Smart CRM (customer relationship management system) that logs every lead and customer interaction, giving each team in a business a shared view rather than separate, siloed records.
The platform's AI layer, called Breeze, is woven through each of those hubs rather than offered as a standalone product. HubSpot ($HUBS) employs 8,882 people and is led by CEO Yamini Rangan.
9. Paycom Software ($PAYC)
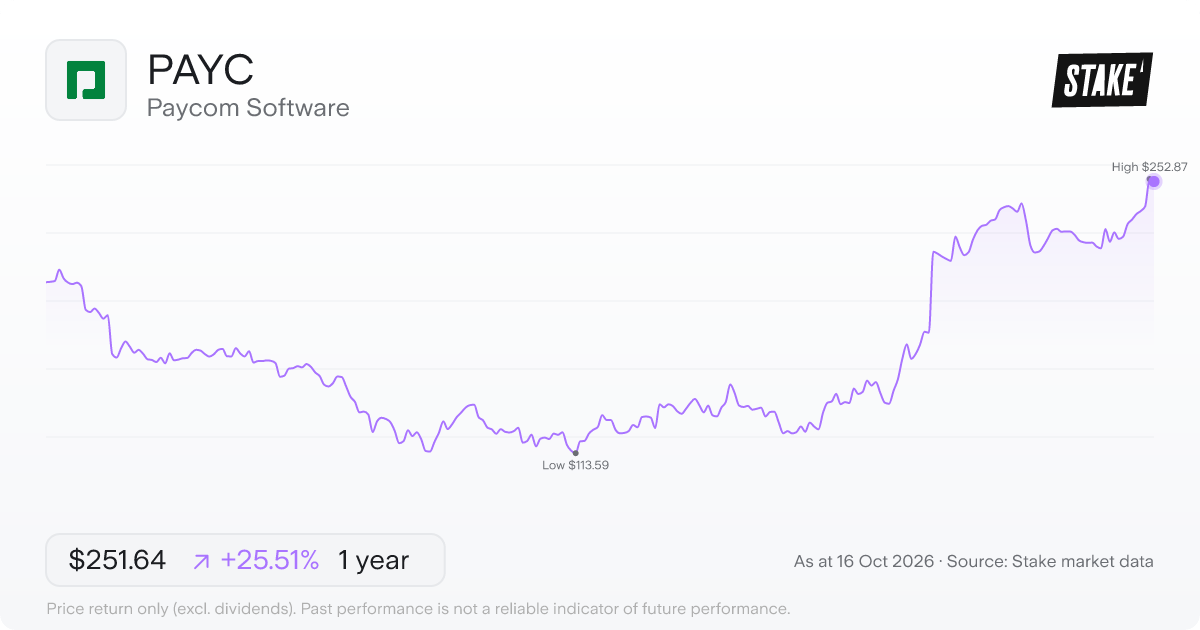
Price: US$252.87 · Daily: 5.8% · Market cap: US$10.77B · Sector: Technology · Industry: Software & IT
Paycom Software ($PAYC) handles the administrative side of employment – everything from posting a job to processing a final paycheck after someone leaves. The platform covers payroll, talent acquisition, performance management, time tracking and HR administration through a single cloud-based system, with all that data sitting in one database rather than spread across separate tools.
What sets the approach apart structurally is that $PAYC requires virtually no customisation, which keeps deployment simpler. Under CEO Chad Richison, the company employs around 5,770 people to support and develop that platform for business clients across the employment lifecycle.
10. GitLab ($GTLB)
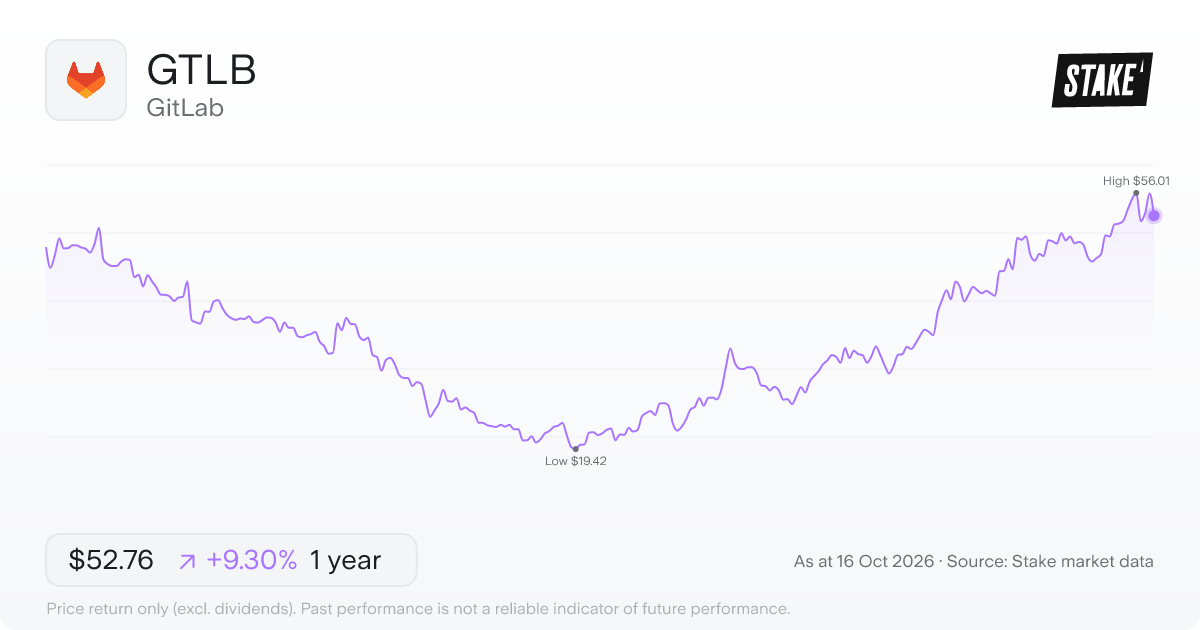
Price: US$55.94 · Daily: 5.2% · Market cap: US$8.86B · Sector: Technology · Industry: Software & IT
GitLab ($GTLB) sits at the point where software development, security and operations meet – a combination the industry calls DevSecOps. The platform is built on a single codebase and a unified interface, so teams can move code from planning through testing, security scanning and deployment without switching between separate tools.
Under CEO Bill Staples, $GTLB employs around 2,580 people and offers its platform in three subscription tiers: Free, Premium and Ultimate. Customers can run it themselves on their own infrastructure or choose a hosted SaaS version – either a shared multi-tenant environment or a dedicated single-tenant setup called GitLab Dedicated. That flexibility is one of the platform's defining characteristics, letting organisations work across hybrid or multi-cloud environments without being locked into one deployment model.
GitLab also sells training and professional services alongside the core subscriptions. Those recurring subscription fees are the engine of the business model, with services sitting alongside as a complement.
➡️ Top 10 U.S. data centre stocks to watch in 2026→
Common questions
How to invest in SaaS stocks in Australia?
Every company in this list trades on U.S. exchanges, so you'll need a share trading platform that offers U.S. market access. From there, you search the ticker, place an order in USD, and the shares settle in your brokerage account. Since these stocks are all priced in USD, movements in the AUD/USD exchange rate affect both what you pay when you buy and what you receive when you sell.
What are the key risks of SaaS stocks?
Many of these companies are priced on expected future revenue rather than current earnings, which makes them more sensitive to any slowdown in growth. A deceleration in new customer additions or a rise in customer churn can reprice a stock sharply. Competition is another persistent risk; cloud infrastructure has lowered the cost of building rival products, and large platform vendors frequently bundle in features that smaller specialists charge separately for. Australian investors also carry AUD/USD currency risk on every position, since all these stocks trade in USD.
What's the difference between horizontal and vertical SaaS?
Horizontal SaaS platforms are built to serve many industries at once – tools for IT workflows, HR, developer collaboration, or customer engagement that almost any organisation might adopt. Vertical SaaS focuses on a single industry; Toast, for example, is purpose-built entirely for restaurants, combining point-of-sale systems, kitchen operations, online ordering and payments in one platform. Most names in this list are horizontal platforms, which gives them a broader potential customer base but also puts them up against more direct competition from other multi-industry vendors.
More resources
✅ Top 10 AI stocks to watch in 2026→
Disclaimer
Past performance is not a reliable indicator of future performance. When you invest, your capital is at risk. You should consider your own investment objectives, financial situation, and particular needs before making an investment decision. The value of your investments can go down as well as up and you may receive back less than your original investment. As always, do your own research and consider seeking appropriate financial advice before investing.
This is not personal financial advice nor a recommendation to invest in the securities listed. Any advice provided by Stake is of general nature only and does not take into account your specific circumstances. Trading and volume data from the Stake investing platform is for reference purposes only, the investment choices of others may not be appropriate for your needs and is not a reliable indicator of performance.
Please refer to hellostake.com/pricing for the fees that apply. When you trade securities priced in another currency, currency conversion fees may apply and movements in the exchange rate may affect your returns.

Stake Desk
The freshest market insights
This article combines AI and human review from our analysts to bring you accurate, informative investing content at speed. For questions or suggestions, contact stakedesk@stake.com.au.
Subscribe
By subscribing, you agree to our Privacy Policy.