Top 10 pharma stocks to watch in 2026
Regulators must approve each drug candidate before it can be sold. A negative trial or rejected application can end a candidate's path to market entirely.
Pharmaceutical companies discover, develop and sell prescription medicines – drugs and biologics targeting conditions from cancer and diabetes to rare genetic diseases and infectious illness. Eli Lilly and Company ($LLY) is the largest on this list by market cap, while Ginkgo Bioworks Holdings ($DNA) operates differently from the rest, selling biological R&D services and platform tools to other companies rather than finished medicines.
How we built this list: We selected these companies based on their industry and relevance to the theme, then ordered them by market capitalisation. Prices are updated daily, and the list and supporting content are reviewed roughly every quarter. All data is sourced from Stake. This list isn't a recommendation and isn't ordered by suitability.
Company Name | Ticker | Share Price | Market Cap | In Watchlists |
|---|---|---|---|---|
Eli Lilly | $1,273.46 | $1.23T | 8412 | |
Johnson & Johnson | $263.81 | $644.22B | 12842 | |
AbbVie | $285.64 | $504.76B | 5275 | |
Merck & Co | $145.27 | $358.41B | 3460 | |
AstraZeneca | $171.49 | $198.91B | 205 | |
Pfizer | $30.03 | $173.38B | 13976 | |
Novo Nordisk A/S | $39.05 | $132.35B | 6276 | |
GSK plc | $50.75 | $103.75B | 1409 | |
Biontech SE | $88.12 | $22.53B | 2683 | |
Ginkgo Bioworks | $9.99 | $624.7M | 875 |
Past performance is not a reliable indicator of future performance.
Source: Stake market data. Figures in US$. Data updated as of 23 October 2026.
✅ Learn more: Top 8 ASX biotech stocks to watch in 2026→
Sign up in minutes and get access to a CHESS-sponsored platform, where you can explore Pharma stocks and more.
1. Eli Lilly ($LLY)
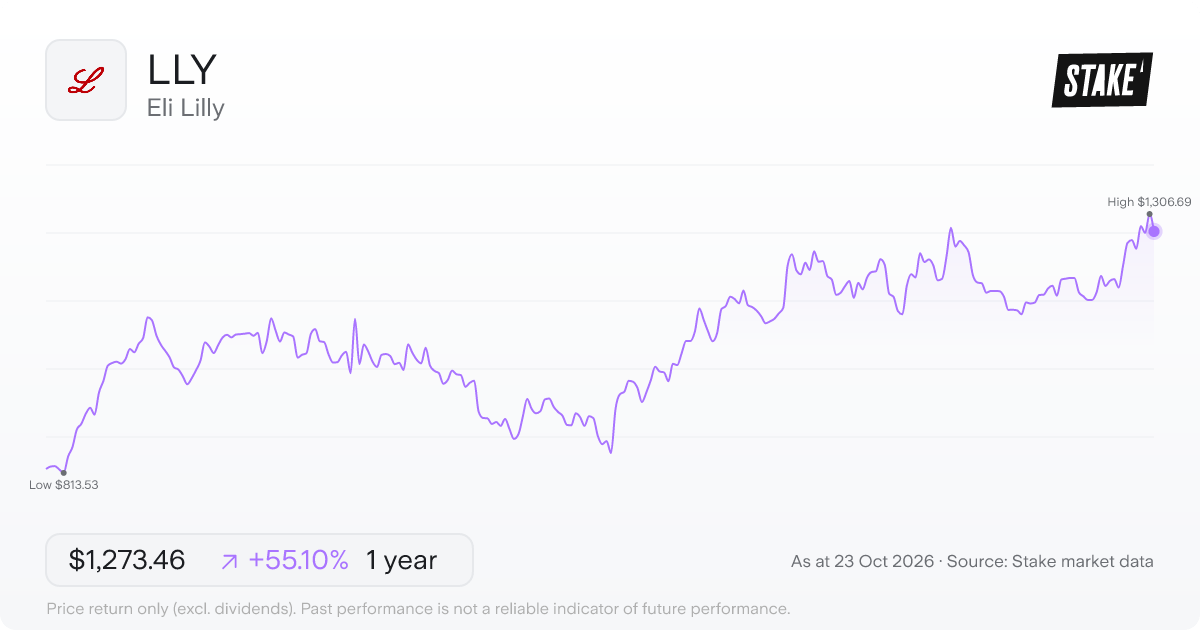
Price: US$1,273.46 · Daily: -2.5% · Market cap: US$1.23T · Sector: Healthcare · Industry: Pharmaceuticals
Eli Lilly and Company ($LLY) discovers, develops, manufactures and markets medicines within a single business segment: human pharmaceutical products. CEO Dave Ricks leads around 50,000 employees across manufacturing sites in the U.S., Europe and Asia.
The cardiometabolic portfolio covers Mounjaro, Zepbound, Jardiance, Trulicity and several insulin products including Humalog and Humulin. Oncology, immunology and neuroscience extend the range with medicines including Verzenio, Erbitux, Taltz, Omvoh, Emgality and Kisunla.
$LLY's products reach patients in approximately 90 countries. The company also runs LillyDirect, a direct-to-patient digital platform that connects people with select Lilly medicines dispensed by third-party pharmacies.
2. Johnson & Johnson ($JNJ)
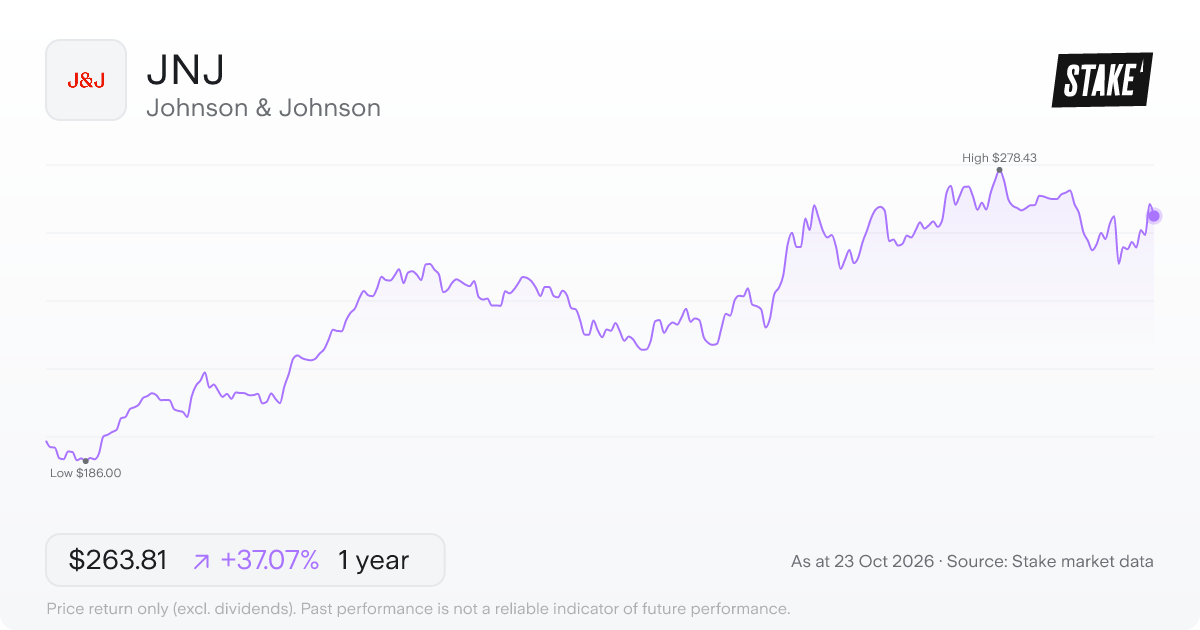
Price: US$263.81 · Daily: -1.4% · Market cap: US$644.22B · Sector: Healthcare · Industry: Pharmaceuticals
Johnson & Johnson ($JNJ) researches, manufactures, and sells healthcare products across two segments: Innovative Medicine and MedTech. The Innovative Medicine side covers oncology, immunology, neuroscience, pulmonary hypertension, infectious diseases, and cardiovascular and metabolic conditions. Named products include DARZALEX (daratumumab) and CARVYKTI (ciltacabtagene autoleucel) for blood cancers, and ERLEADA (apalutamide) for prostate cancer.
The MedTech segment develops devices for cardiovascular procedures, orthopaedics, surgery, and vision care – used by hospitals, physicians, and eye care professionals. $JNJ is also developing its proprietary Firelink degrader antibody conjugate platform. Joaquin Duato leads the company, which employs 138,200 people.
3. AbbVie ($ABBV)
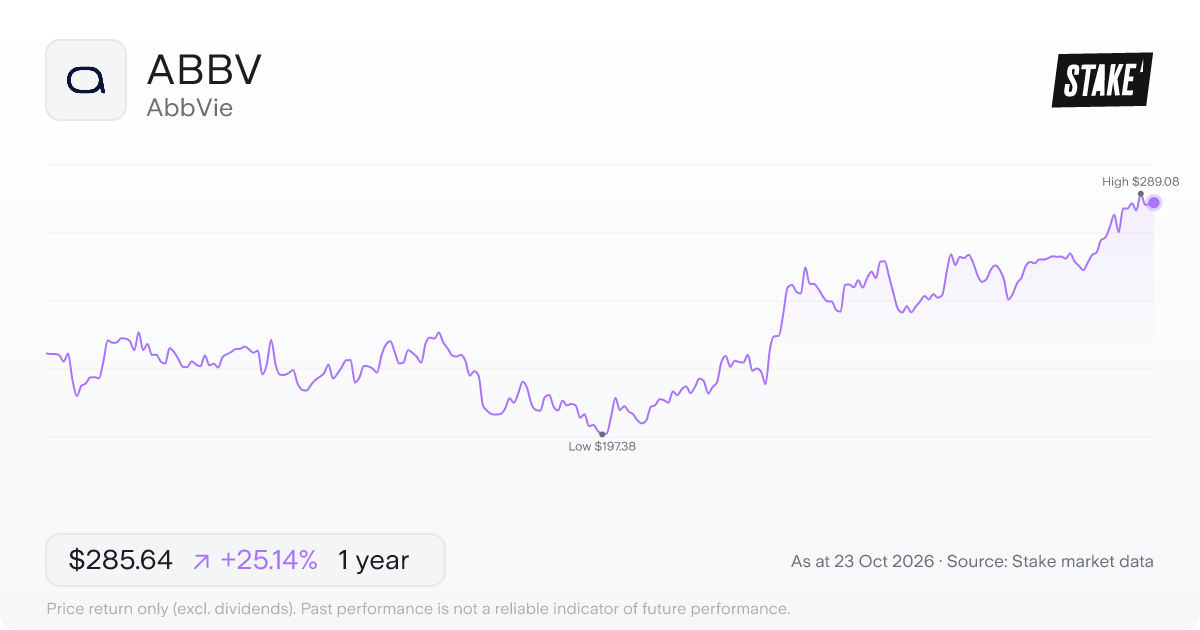
Price: US$285.64 · Daily: 0.2% · Market cap: US$504.76B · Sector: Healthcare · Industry: Pharmaceuticals
AbbVie Inc. ($ABBV) covers a wide range of therapy areas – its portfolio runs from immunology drugs targeting rheumatology and dermatology, to cancer treatments like Imbruvica and Venclexta, to a neuroscience lineup that includes Botox Therapeutic for clinical use and Vraylar for mood disorders. It also holds an aesthetics division covering facial injectables, body contouring and skincare, which sits alongside eye care products and treatments for conditions like Parkinson's disease and hepatitis C.
Under chief executive Robert Michael, the company employs around 57,000 people and continues building its pipeline, with candidates including zumilokibart and APG273 in development. $ABBV draws revenue across both prescription medicines and aesthetics.
4. Merck & Co ($MRK)
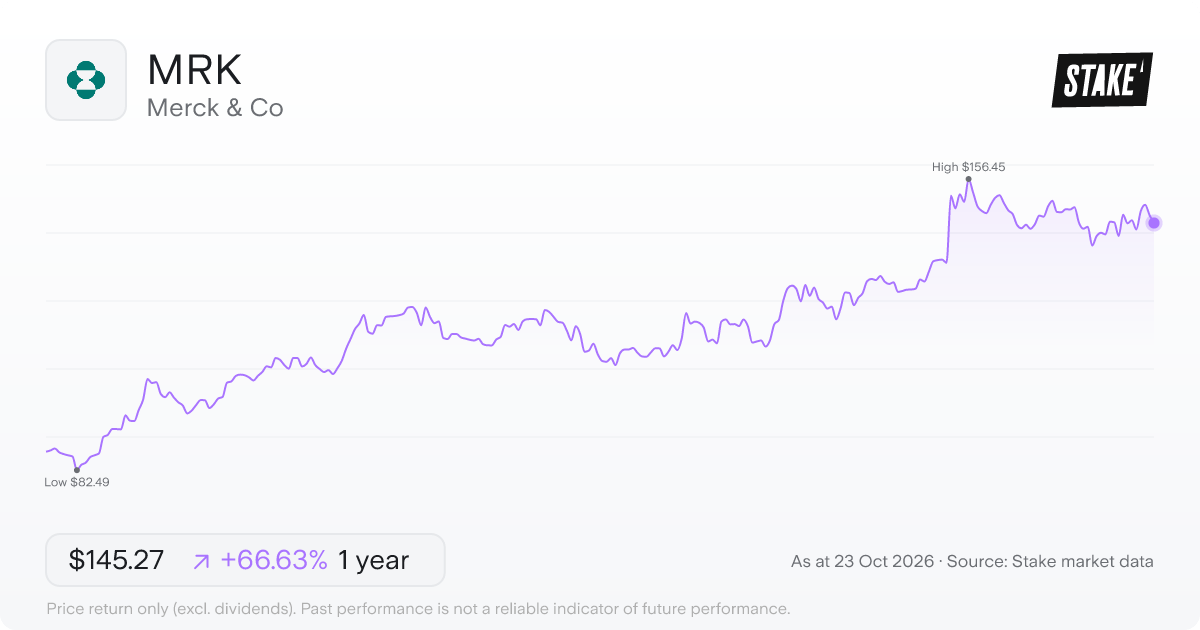
Price: US$145.27 · Daily: -1.3% · Market cap: US$358.41B · Sector: Healthcare · Industry: Pharmaceuticals
Merck & Co ($MRK) operates across two distinct arms: a pharmaceutical business selling prescription medicines and vaccines to hospitals, wholesalers, governments and managed care providers, and an animal health division that covers livestock and companion animals. The animal health side develops and markets veterinary medicines, vaccines and health management services across a broad range of species.
KEYTRUDA (pembrolizumab) is one of $MRK's most recognised products – an injectable cancer immunotherapy delivered intravenously. The company also markets WELIREG for certain tumour types and Ohtuvayre for respiratory use. With around 75,000 employees and CEO Rob Davis at the helm, $MRK has the scale to run global clinical development programmes alongside commercial operations.
5. AstraZeneca ($AZN)
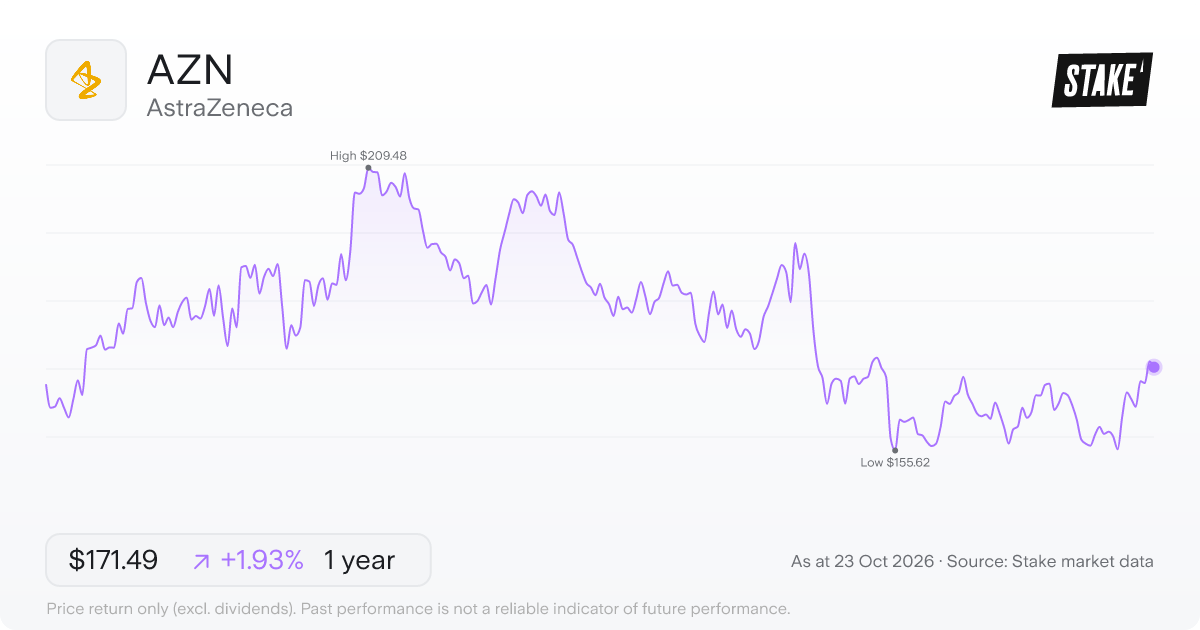
Price: US$171.49 · Daily: -0.6% · Market cap: US$198.91B · Sector: Healthcare · Industry: Pharmaceuticals
AstraZeneca ($AZN) is a UK-based biopharmaceutical company focused on discovering, developing and commercialising prescription medicines. Its pipeline covers five therapy areas: oncology, cardiovascular and metabolic disease, respiratory and immunology, vaccines and immune therapies, and rare disease.
The oncology portfolio includes medicines like Tagrisso, Imfinzi and Enhertu. On the cardiovascular and metabolic side, Farxiga/Forxiga and Brilinta/Brilique are among the key products. $AZN distributes across more than 125 countries, with around 96,100 employees and Pascal Soriot as chief executive.
The company says its development pipeline holds about 191 projects. Of those, 19 are late-stage new molecular entities (NMEs) – novel drug candidates, rather than reformulations of existing ones.
Join 1M+ on Stake
Effortless investing in U.S. shares & ETFs
6. Pfizer ($PFE)
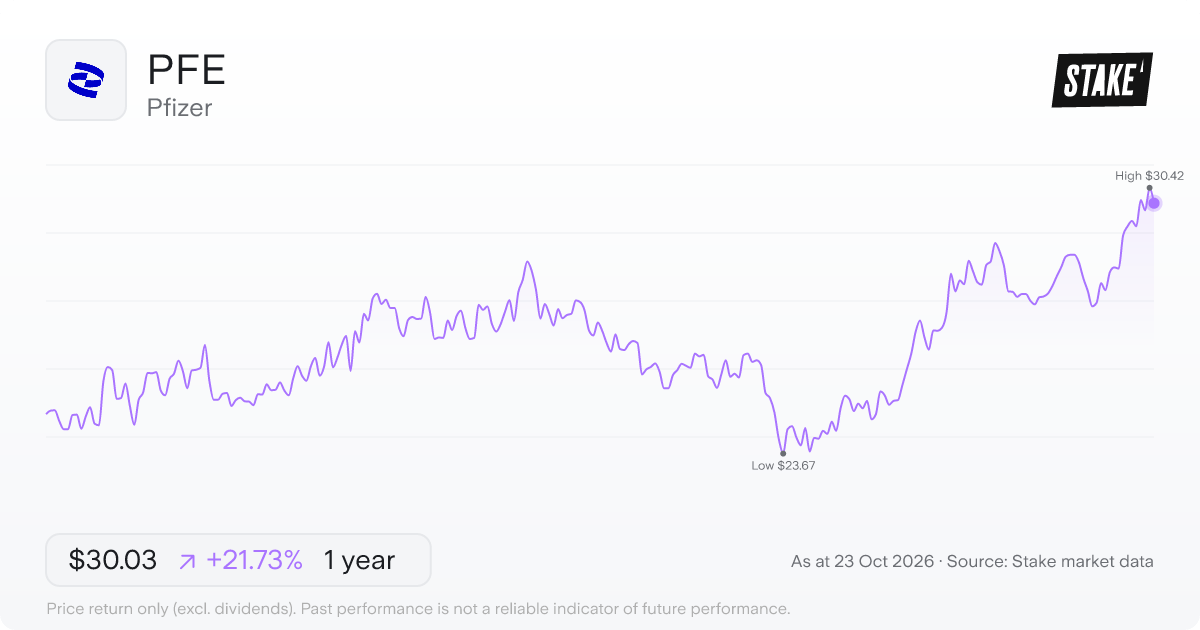
Price: US$30.03 · Daily: -1.3% · Market cap: US$173.38B · Sector: Healthcare · Industry: Pharmaceuticals
Pfizer Inc. ($PFE) operates across the full pharmaceutical value chain – discovery, manufacturing, marketing and distribution – with 75,000 employees and Albert Bourla as chief executive. Its product portfolio runs across three categories: oncology, primary care and specialty care.
The oncology shelf includes drugs like Ibrance and Padcev, while primary care covers vaccines such as the Prevnar family and Comirnaty alongside antivirals like Paxlovid. Specialty care adds treatments in inflammation, rare disease and growth disorders, among other areas.
The company is also developing PF-08653944, an ultra-long-acting GLP-1 receptor agonist – a class of drugs that targets metabolic pathways. Like any candidate, it must complete clinical trials and gain regulatory approval before it could reach market.
7. Novo Nordisk A/S ($NVO)
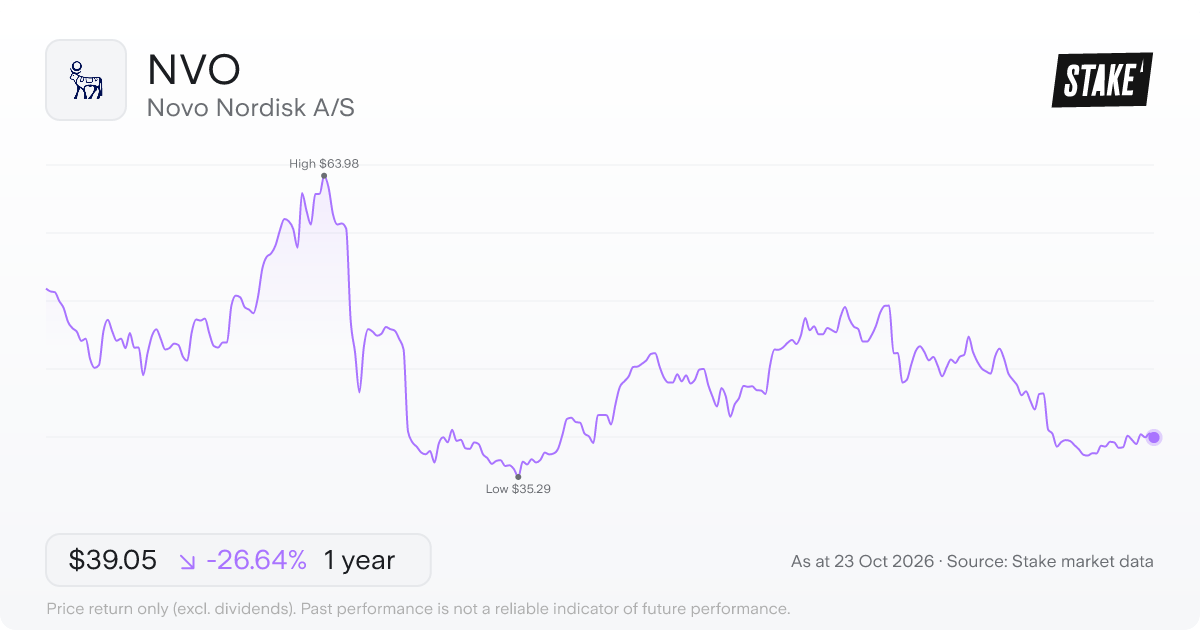
Price: US$39.05 · Daily: -1.0% · Market cap: US$132.35B · Sector: Healthcare · Industry: Pharmaceuticals
Novo Nordisk A/S ($NVO) built its name on diabetes care, and that remains the core of what it does. Its diabetes and obesity segment covers insulin, GLP-1 receptor agonists, oral anti-diabetic drugs and the delivery systems that go with them – the pens and needles that reach patients in over 180 countries.
A second segment, biopharmaceuticals, covers hemophilia care, growth hormone therapy and hormone replacement therapy. Products like NovoSeven for bleeding disorders and Norditropin for growth hormone deficiency sit here, alongside Vagifem for hormone replacement.
Under CEO Maziar Doustdar, the company employs 68,794 people across its North America and International Operations commercial units. Saxenda, its obesity treatment, extends the weight-management side of the diabetes and obesity segment beyond blood sugar management alone.
8. GSK plc ($GSK)
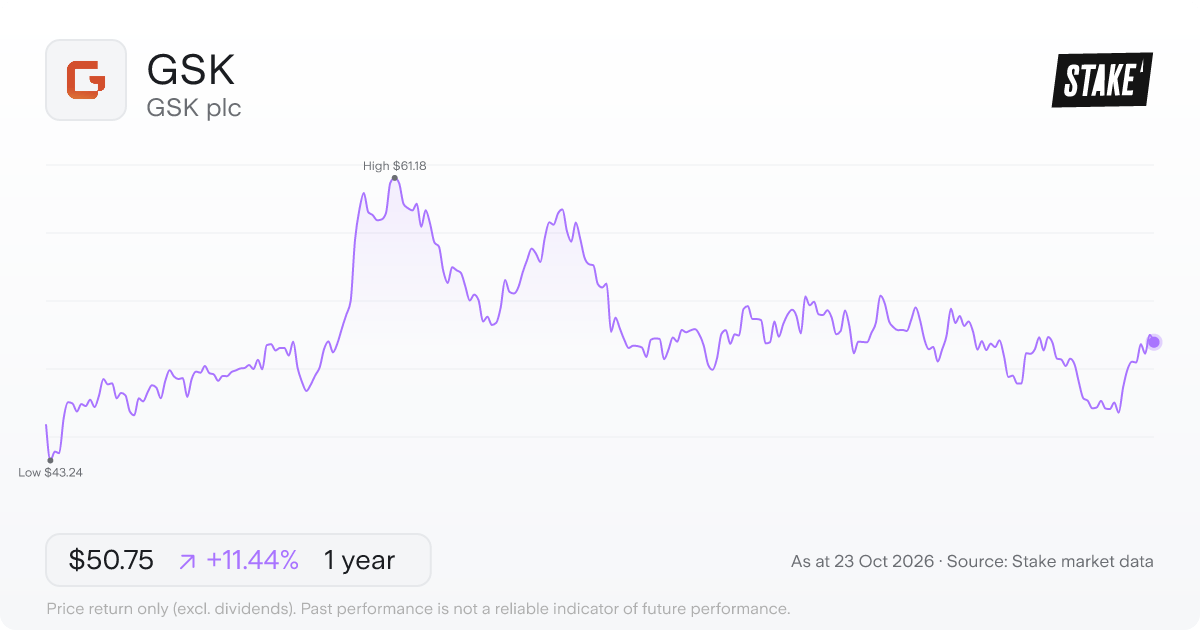
Price: US$50.75 · Daily: -0.9% · Market cap: US$103.75B · Sector: Healthcare · Industry: Pharmaceuticals
GSK plc ($GSK) is a UK-based biopharma company centred on the science of the immune system. It works across four therapeutic areas: respiratory and inflammatory conditions, oncology, HIV and infectious diseases. Its medicines include inhalers for asthma and chronic obstructive pulmonary disease (COPD), HIV treatments such as Dovato, and cancer medicines including Blenrep. The pipeline includes ozureprubart – an anti-immunoglobulin E (IgE) monoclonal antibody – alongside oncology compounds like Zidesamtinib and neladalkib.
9. Biontech SE ($BNTX)
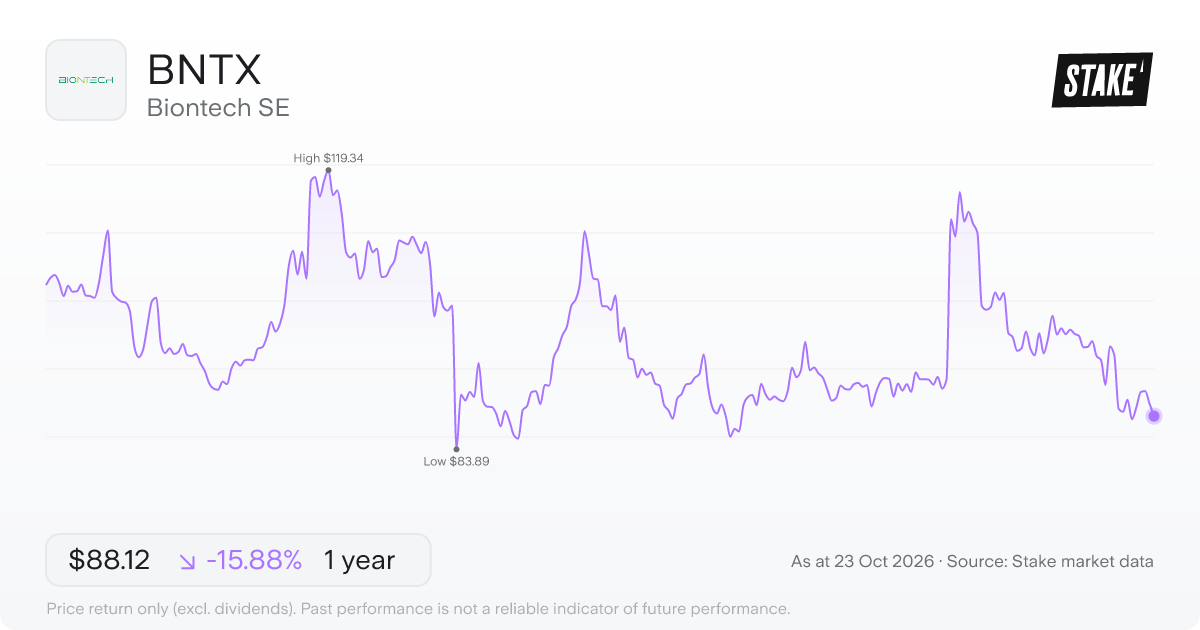
Price: US$88.12 · Daily: -1.7% · Market cap: US$22.53B · Sector: Healthcare · Industry: Biotech
BioNTech SE ($BNTX) develops patient-specific immunotherapies aimed at treating cancer and other serious diseases. The company uses several technology platforms – mRNA-based therapies, cell therapies, antibodies and small molecules – and can combine them to target individual patients' conditions.
Its pipeline includes individualised mRNA-based product candidates, chimeric antigen receptor T-cell (CAR-T) therapies, checkpoint immunomodulators and targeted cancer antibodies. The company also develops diagnostic products and drug discovery services covering infectious diseases, allergies and autoimmune disorders.
Based in Germany and led by CEO Ugur Sahin, the company employs 7,807 people. As a clinical-stage company, its candidates are still moving through development and regulatory review.
10. Ginkgo Bioworks ($DNA)
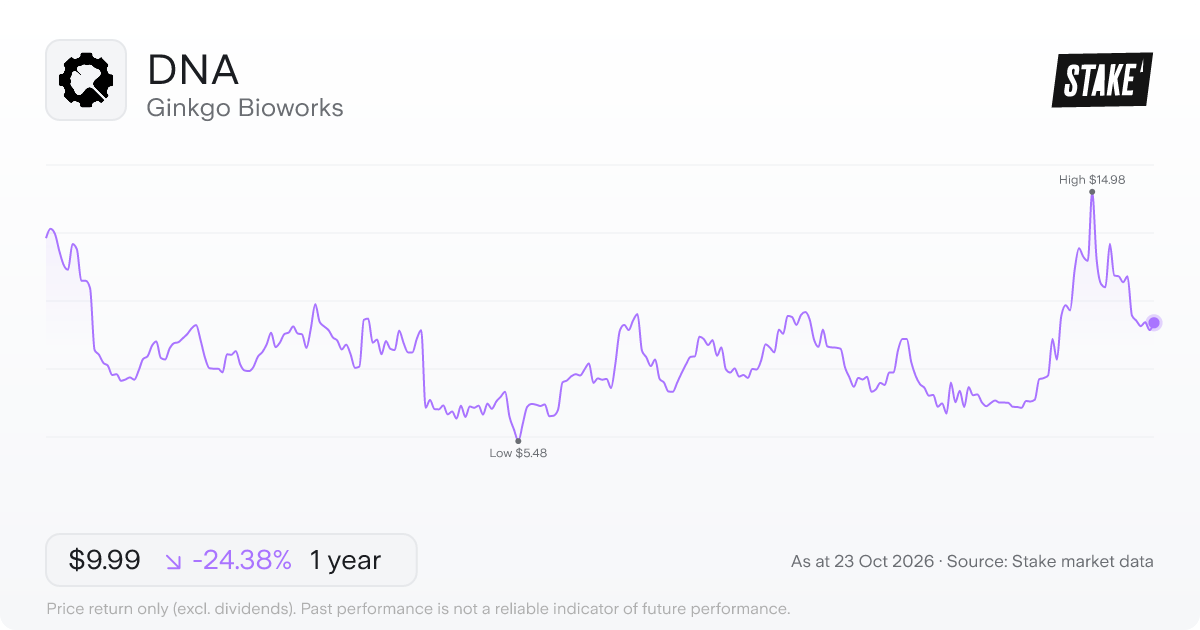
Price: US$9.99 · Daily: 2.9% · Market cap: US$624.7M · Sector: Healthcare · Industry: Biotech
Ginkgo Bioworks Holdings ($DNA) runs an R&D platform and autonomous laboratory that other companies use to do the biological groundwork behind products they're developing. Commercial businesses and government agencies both draw on $DNA's tools to engineer cells and create new products across medicine, agriculture and industrial biotechnology. The autonomous lab is also available as Cloud Lab, accessed through contract research services called Datapoints and Solutions.
The company operates through a single segment – cell engineering – which covers gene therapy, cell therapy, gene editing and RNA therapeutics. Protein engineering microservices for product developers round out the portfolio. CEO Jason Kelly leads the company's 485 employees.
➡️ Top ASX healthcare stocks to watch in 2026→
Common questions
How do I invest in pharma stocks in Australia?
All ten companies on this list trade on U.S. exchanges. You can buy them through a share trading platform that offers access to U.S. markets – search by ticker, place an order and buy whichever companies you choose. Because each is an individual stock, building exposure to the sector means selecting specific companies rather than buying across the group through a single fund.
What are the key risks of pharma stocks?
Some of the key risks include regulatory risk – drug candidates need a regulator's sign-off before they can be sold, and that approval isn't always granted – pipeline failure, where candidates don't deliver the results needed in clinical trials, and patent expiry, which opens the door to generic or biosimilar competition once market exclusivity lapses. Companies that draw most of their revenue from a single product or therapy area carry more concentration risk than those with broader portfolios. All ten stocks on this list are priced in USD, so movements between the Australian dollar and the U.S. dollar affect what a purchase costs and what proceeds are worth in AUD.
How do the companies on this list differ in what they actually do?
Most of the names here are established pharmaceutical businesses with medicines already on the market and revenue flowing from existing products across multiple therapy areas. $BNTX sits differently – as a clinical-stage company, its pipeline candidates are still working through development and regulatory review rather than generating commercial sales at scale. $DNA is different again: it runs an R&D platform and autonomous lab that other organisations use to do the biological groundwork behind their own products, rather than developing and marketing its own medicines directly to patients.
More resources
✅ Top 10 ASX blue chip shares to watch in 2026→
Disclaimer
Past performance is not a reliable indicator of future performance. When you invest, your capital is at risk. You should consider your own investment objectives, financial situation, and particular needs before making an investment decision. The value of your investments can go down as well as up and you may receive back less than your original investment. As always, do your own research and consider seeking appropriate financial advice before investing.
This is not personal financial advice nor a recommendation to invest in the securities listed. Any advice provided by Stake is of general nature only and does not take into account your specific circumstances. Trading and volume data from the Stake investing platform is for reference purposes only, the investment choices of others may not be appropriate for your needs and is not a reliable indicator of performance.
Please refer to hellostake.com/pricing for the fees that apply. When you trade securities priced in another currency, currency conversion fees may apply and movements in the exchange rate may affect your returns.

Stake Desk
The freshest market insights
This article combines AI and human review from our analysts to bring you accurate, informative investing content at speed. For questions or suggestions, contact stakedesk@stake.com.au.
Subscribe
By subscribing, you agree to our Privacy Policy.