Top U.S.-listed investment banks to watch in 2026

Investment bank revenue depends on deal flow. Advisory fees follow corporate transactions, while trading income tracks market volumes and volatility.
Investment banks sit at the centre of some of the largest transactions in the global economy – advising on mergers, underwriting share sales and trading bonds and currencies for institutional clients. The six firms range from full-service giants to pure advisory boutiques: Morgan Stanley ($MS) runs wealth and asset management alongside its investment bank, while Evercore ($EVR) advises on M&A and restructuring. Nomura Holdings ($NMR) is the only firm here headquartered outside the U.S., with a presence in Japan, the Americas, Europe, Asia and Oceania.
How we built this list: We selected these companies based on their investment banking, capital markets and advisory business and ordered them by market capitalisation. Prices are updated daily, and the list and supporting content are reviewed roughly every quarter. All data is sourced from Stake. This list isn't a recommendation and isn't ordered by suitability.
Company Name | Ticker | Share Price | Market Cap | In Watchlists |
|---|---|---|---|---|
Morgan Stanley | $178.47 | $282.59B | 1779 | |
Goldman Sachs | $875.78 | $256.60B | 3680 | |
Citi | $121.69 | $205.68B | 2778 | |
Nomura Holdings, Inc. | $9.12 | $28.61B | 153 | |
Jefferies Financial Group | $43.60 | $10.01B | 169 | |
Evercore | $247.96 | $10.43B | 90 |
Past performance is not a reliable indicator of future performance.
Source: Stake market data. Figures in US$. Data updated as of 19 October 2026.
✅ Learn more: Top U.S.-listed asset managers to watch in 2026→
Sign up in minutes and get access to a CHESS-sponsored platform, where you can explore U.S.-listed investment banks and more.
1. Morgan Stanley ($MS)
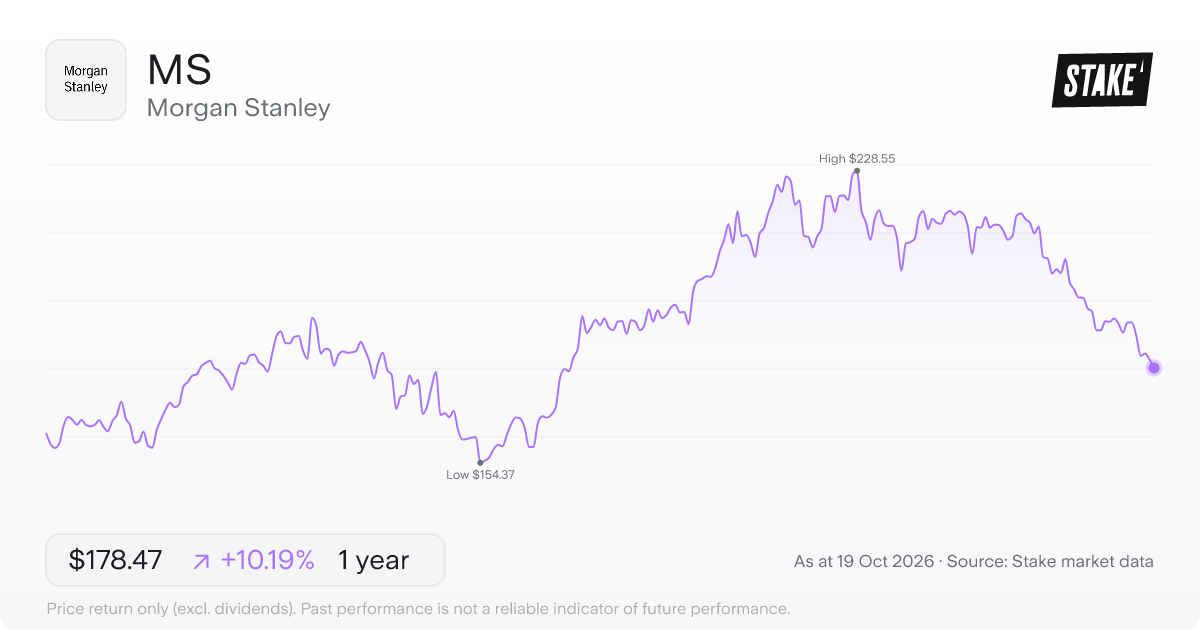
Price: US$178.47 · Daily: -1.2% · Market cap: US$282.59B · Sector: Financials · Industry: Investment Services
Morgan Stanley ($MS) runs three distinct businesses under one roof. Its Institutional Securities segment works with corporations, governments and financial institutions on capital raising, mergers advice, and debt underwriting. The Wealth Management arm serves individual investors and smaller businesses, while Investment Management handles strategies across asset classes and both public and private markets.
With 83,000 employees and Ted Pick as chief executive, $MS operates at a scale that lets it move across borders and asset classes within a single client relationship. That breadth – from advising a government on a bond sale to managing a private individual's portfolio – is what sets a full-service firm apart from a pure advisory boutique.
2. Goldman Sachs ($GS)
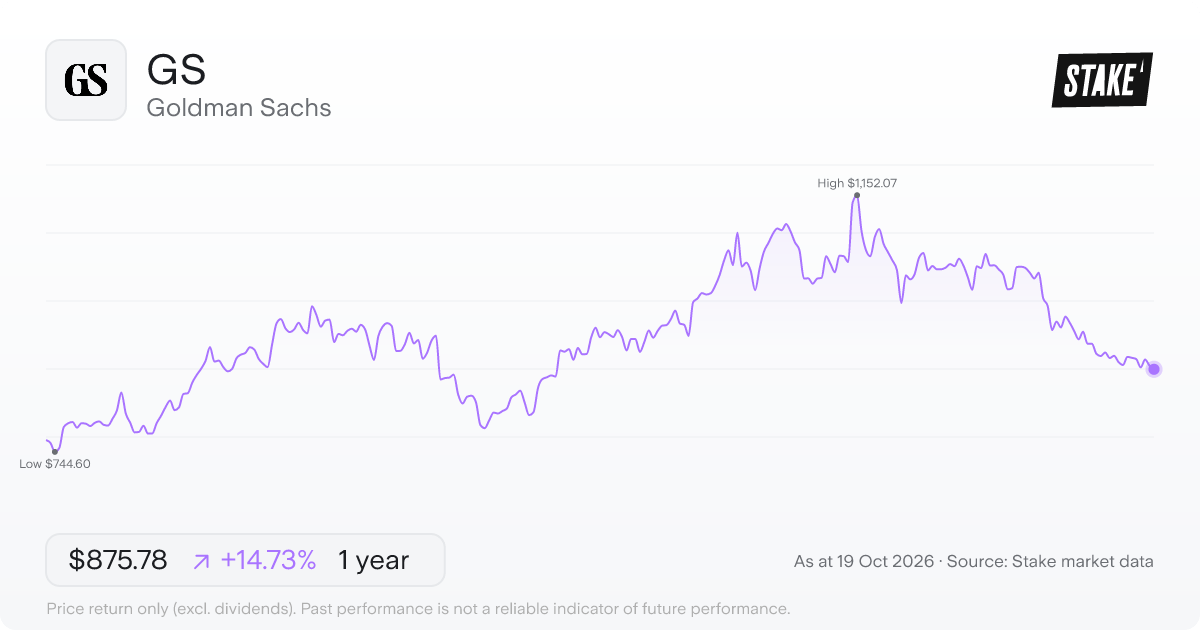
Price: US$875.78 · Daily: -0.6% · Market cap: US$256.60B · Sector: Financials · Industry: Investment Services
Three business lines define how Goldman Sachs Group ($GS) operates. The Global Banking & Markets segment advises corporations and governments on transactions, underwrites securities and makes markets in fixed income, equities, currencies and commodities. Under CEO David Solomon, the firm employs 47,400 people globally.
The Asset & Wealth Management segment manages assets across every major asset class for institutions and individual investors alike. It also provides investing and advisory solutions to a broad client base. The third segment – Platform Solutions – handles the more consumer-facing activity, including credit card partnerships, point-of-sale financing and transaction banking.
3. Citi ($C)
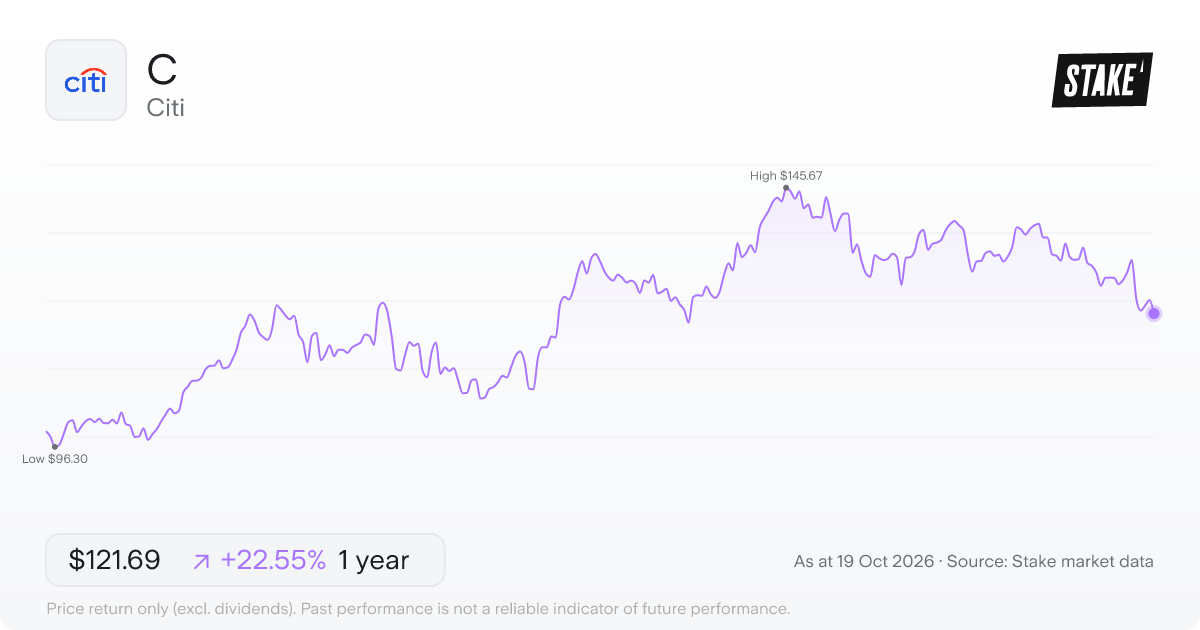
Price: US$121.69 · Daily: -2.1% · Market cap: US$205.68B · Sector: Financials · Industry: Investment Services
Citigroup ($C) operates across a wide range of financial services, from helping multinational corporations manage cash and trade finance to running trading desks in equities, foreign exchange, rates and commodities. Its Banking segment handles capital-raising for corporate and institutional clients, while the Wealth segment – covering private banking, Citigold and wealth at work services – serves individual clients at various levels. CEO Jane Fraser leads a workforce of 226,000 people globally.
The U.S. Consumer Cards segment adds a retail dimension that most pure investment banks don't carry, covering branded, co-branded and private label cards alongside installment lending. That mix makes $C a diversified financial services business rather than a focused advisory or trading house.
Join 1M+ on Stake
Effortless investing in U.S. shares & ETFs
4. Nomura Holdings, Inc. ($NMR)
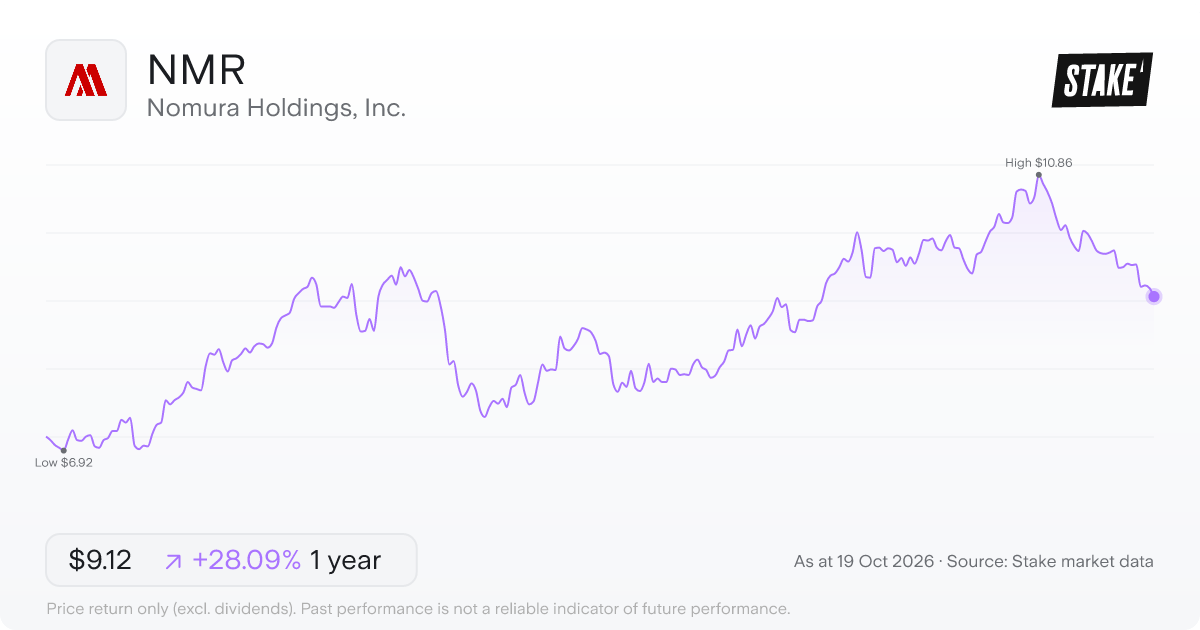
Price: US$9.12 · Daily: -1.3% · Market cap: US$28.61B · Sector: Financials · Industry: Investment Services
Nomura Holdings, Inc. ($NMR) is headquartered in Japan and operates across Japan, the Americas, Europe, Asia and Oceania. Its wholesale arm trades bonds, equities, derivatives and foreign exchange, and handles investment banking work including M&A advisory and securities underwriting for institutional clients.
$NMR's investment management segment serves domestic and foreign investors through funds, discretionary mandates and investment trusts. A separate retail-facing business provides investment consultation to individual clients in Japan.
5. Jefferies Fincl ($JEF)
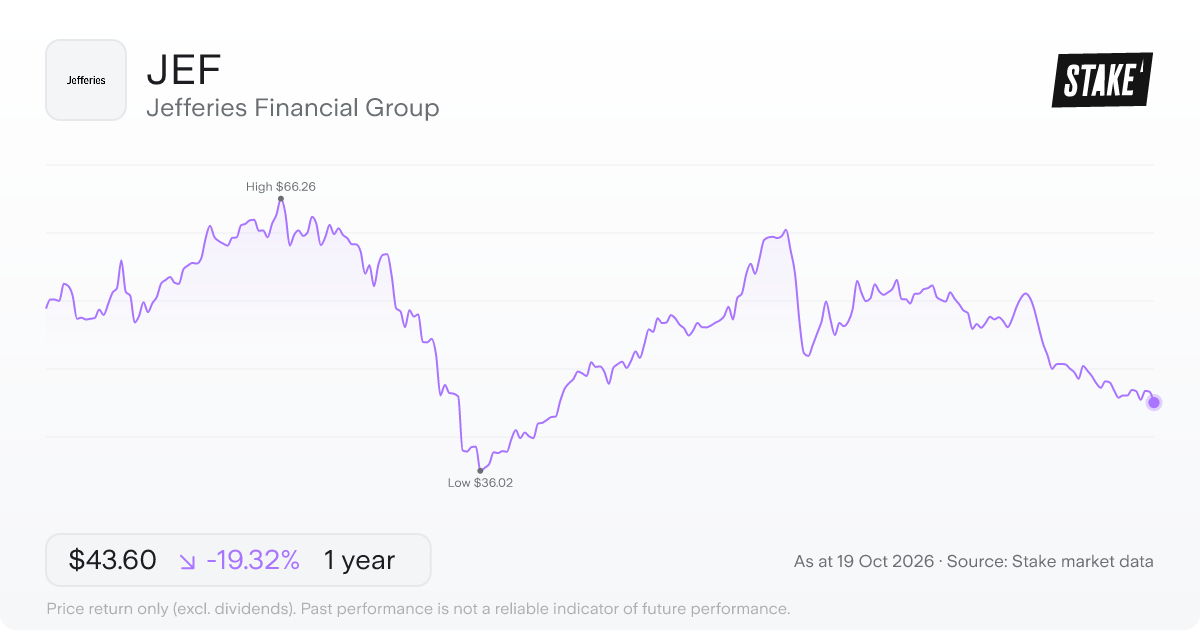
Price: US$43.60 · Daily: -2.7% · Market cap: US$10.01B · Sector: Financials · Industry: Investment Services
Jefferies Financial Group ($JEF) runs two distinct businesses under one roof. The larger is investment banking and capital markets, where the firm underwrites equity and debt offerings and advises on transactions for clients. Alongside that sits an asset management arm, which runs alternative investment strategies and also holds assets from an older merchant banking portfolio.
The firm's geographic reach covers the Americas, Europe and the Middle East, and Asia-Pacific, with around 7,787 employees across those regions. CEO Rich Handler has led $JEF for well over two decades, an unusually long tenure for a firm of this size. The capital markets side touches fixed income, equities, and advisory work, so its revenue tends to move with deal activity and market volumes.
Unlike some names on this list that pair investment banking with large retail or consumer divisions, $JEF keeps its focus tightly on institutional and corporate clients. Its asset management segment adds a different revenue stream, but the investment banking and capital markets business remains the core of what the firm does.
6. Evercore US ($EVR)
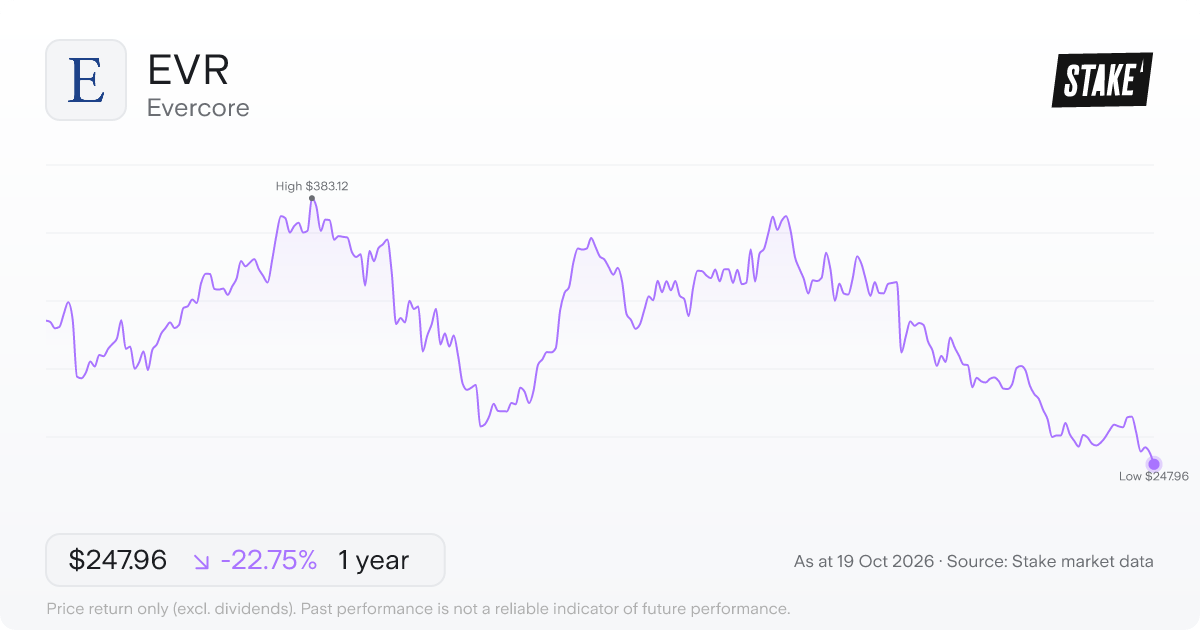
Price: US$247.96 · Daily: -2.4% · Market cap: US$10.43B · Sector: Financials · Industry: Investment Services
Evercore Inc. ($EVR) has built its business around advice rather than trading. Under chief executive John Weinberg, the firm's 2,570 employees focus on guiding multinational corporations and private equity firms through some of the largest and most complex transactions in the market – mergers, acquisitions, divestitures and shareholder activism situations. When companies hit financial difficulty, $EVR also steps in on the other side of the table, advising on liability management and restructuring for distressed borrowers, creditors and potential acquirers alike.
The firm also runs an investment management arm, though it sits apart from the advisory business in both purpose and clientele. That segment covers wealth management and fiduciary services for high-net-worth individuals, along with interests in private equity funds that $EVR doesn't manage directly. The advisory focus means the firm doesn't carry a large trading book, which shapes its revenue profile and the kinds of market conditions it's most exposed to.
➡️ Top private equity stocks to watch in 2026→
Common questions
How to invest in U.S. investment banks from Australia?
The companies in this list trade on U.S. exchanges rather than the ASX, so you'd need a brokerage platform with U.S. market access to buy them. Trades settle in USD, meaning your AUD converts at the prevailing exchange rate when you buy and again when you sell. Movements between the AUD and USD feed into the value of your position alongside the stock's own performance.
What are the key risks of investing in investment banks?
Revenue in this sector is closely tied to deal flow and market conditions – advisory fees and capital markets activity can fall sharply when deal-making slows or volatility spikes. Firms with large trading operations carry mark-to-market exposure, where positions can move against them quickly in stressed markets. Capital and liquidity regulations also constrain how these businesses operate and how freely they can return cash. For Australian investors, there's an added layer of currency risk: any gains or losses in USD translate back to AUD at whatever rate applies at the time.
How do advisory-focused firms differ from full-service investment banks?
Full-service institutions like Morgan Stanley, Goldman Sachs and Citi run large trading operations, manage significant asset pools and – in Citi's case – operate consumer financial products alongside their investment banking work. That balance-sheet depth brings heavier capital requirements and broader regulatory obligations. Evercore sits at the other end of the spectrum, concentrating on advisory mandates – mergers, acquisitions, restructuring and strategic transactions – without the same trading or lending exposure. Jefferies occupies a middle position, combining capital markets and trading activity with its advisory business.
More resources
✅ Top 10 ASX bank shares to watch in 2026→
Disclaimer
Past performance is not a reliable indicator of future performance. When you invest, your capital is at risk. You should consider your own investment objectives, financial situation, and particular needs before making an investment decision. The value of your investments can go down as well as up and you may receive back less than your original investment. As always, do your own research and consider seeking appropriate financial advice before investing.
This is not personal financial advice nor a recommendation to invest in the securities listed. Any advice provided by Stake is of general nature only and does not take into account your specific circumstances. Trading and volume data from the Stake investing platform is for reference purposes only, the investment choices of others may not be appropriate for your needs and is not a reliable indicator of performance.
Please refer to hellostake.com/pricing for the fees that apply. When you trade securities priced in another currency, currency conversion fees may apply and movements in the exchange rate may affect your returns.

Stake Desk
The freshest market insights
This article combines AI and human review from our analysts to bring you accurate, informative investing content at speed. For questions or suggestions, contact stakedesk@stake.com.au.
Subscribe
By subscribing, you agree to our Privacy Policy.