Top 10 U.S.-listed index funds to watch in 2026

An index fund mirrors its benchmark exactly, with no manager stepping in. For Australian investors, the AUD/USD rate layers on top of whatever the index does.
Index funds hold the securities in a market benchmark rather than picking individual stocks, aiming to mirror that index's performance through a single trade. The ten funds in this list hold a range of markets: State Street SPDR S&P 500 ETF Trust ($SPY) tracks U.S. large-cap equities, while the list also includes bond funds, a real estate tracker and an emerging markets fund, with annual fees between 0.03% and 0.49%.
How we built this list: We selected these funds based on their industry or investment category and ordered them by assets under management. Prices are updated daily, and the list and supporting content are reviewed roughly every quarter. All data is sourced from Stake. This list isn't a recommendation and isn't ordered by suitability.
ETF Name | Ticker | Share Price | AUM | Expense Ratio | In Watchlists |
|---|---|---|---|---|---|
State Street SPDR S&P 500 ETF Trust | $773.09 | $818.39B | 0.09% | 28346 | |
Vanguard Morningstar Total Stock Mkt ETF | $379.15 | $689.22B | 0.03% | 17496 | |
Vanguard Total Bond Market ETF | $70.75 | $161.44B | 0.03% | 1772 | |
Vanguard FTSE Emerging Markets ETF | $58.18 | $125.42B | 0.07% | 2371 | |
Invesco NASDAQ 100 ETF | $298.64 | $108.49B | 0.15% | 11603 | |
iShares Russell 2000 ETF | $276.48 | $75.14B | 0.19% | 1912 | |
Vanguard FTSE All-World ex US ETF | $82.14 | $68.15B | 0.05% | 1321 | |
State Street SPDR Dow Jones Indust Avg ETF Trust | $527.70 | $45.00B | 0.16% | 2978 | |
Vanguard Real Estate ETF | $91.49 | $35.95B | 0.12% | 3651 | |
iShares iBoxx $ High Yield Corporate Bond ETF | $76.98 | $16.20B | 0.49% | 254 |
Past performance is not a reliable indicator of future performance.
Source: Stake market data. Figures in US$. Data updated as of 21 October 2026.
✅ Learn more: Top 10 index funds to watch in 2026→
Sign up in minutes and get access to a CHESS-sponsored platform, where you can explore U.S. index funds and more.
1. State Street SPDR S&P 500 ETF Trust ($SPY)
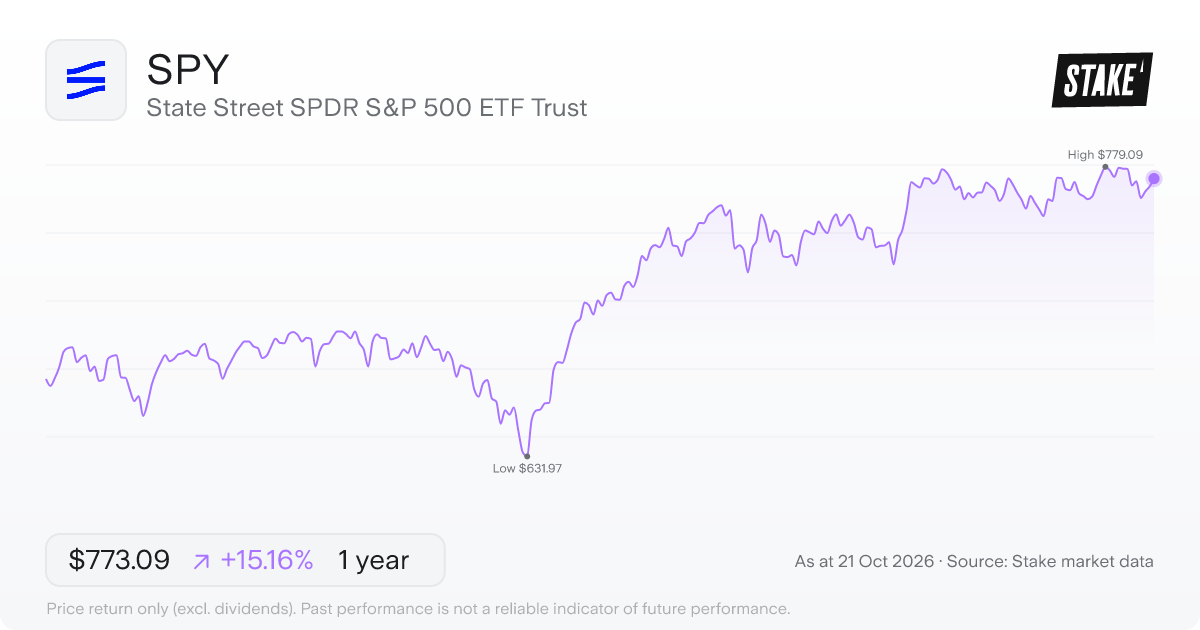
Price: US$773.09 · Daily: 0.5% · AUM: US$818.39B · MER: 0.09%
Designed to track the price and yield performance of the S&P 500 Index, the State Street SPDR S&P 500 ETF Trust ($SPY) holds substantially all of the common stocks that make up the index. Each stock is weighted according to the terms of the fund's trust agreement, so the portfolio aims to mirror the index's composition at any point. When companies enter or leave the S&P 500, or their relative weight in the index shifts, the fund's holdings adjust in line.
The S&P 500 covers 500 large U.S. companies drawn from a wide range of industries. $SPY is built to reflect that broad sweep of U.S. large-cap equities as a single fund.
2. Vanguard Morningstar Total Stock Mkt Ix Fd ($VTI)
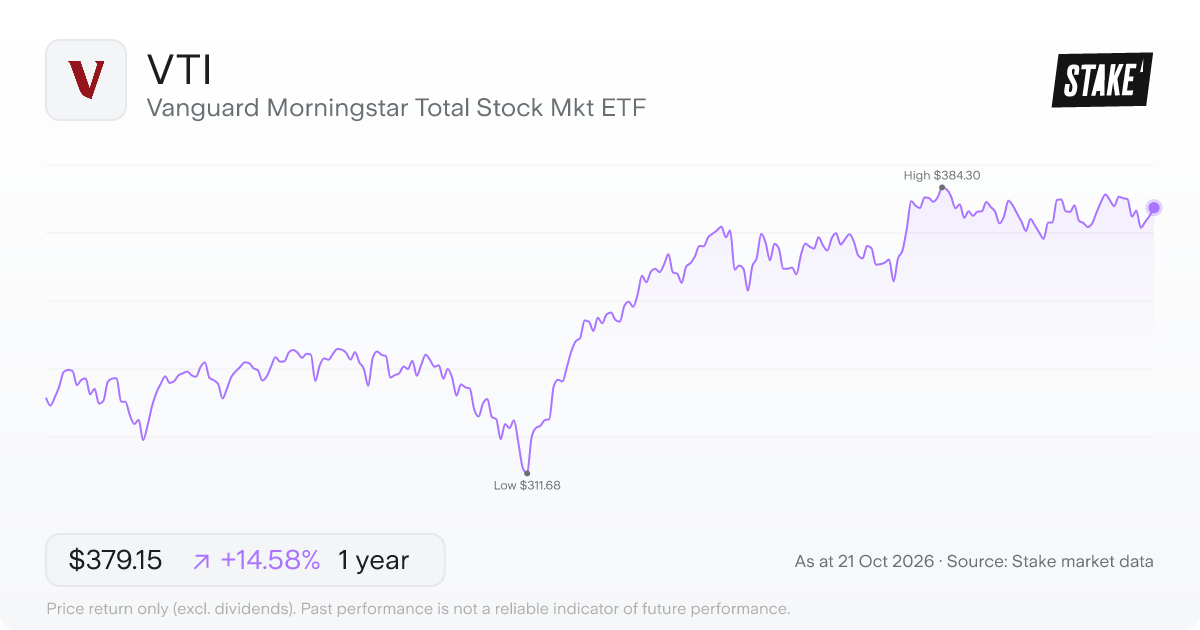
Price: US$379.15 · Daily: 0.5% · AUM: US$689.22B · MER: 0.03%
Vanguard Morningstar Total Stock Mkt Ix Fd ($VTI) aims to track the CRSP US Total Market Index, a benchmark designed to measure the investment return of the U.S. stock market as a whole. The fund uses a passive indexing approach, holding a collection of securities intended to approximate that index's composition.
Because the index targets the overall market rather than a narrower segment, $VTI's holdings are intended to reflect U.S. equities broadly. The portfolio adjusts as the index changes, with no active stock selection involved. The fund is designed to replicate the index's return – tracking the market as it moves, not attempting to outperform it.
3. Vanguard Total Bond Market Index Fund ($BND)
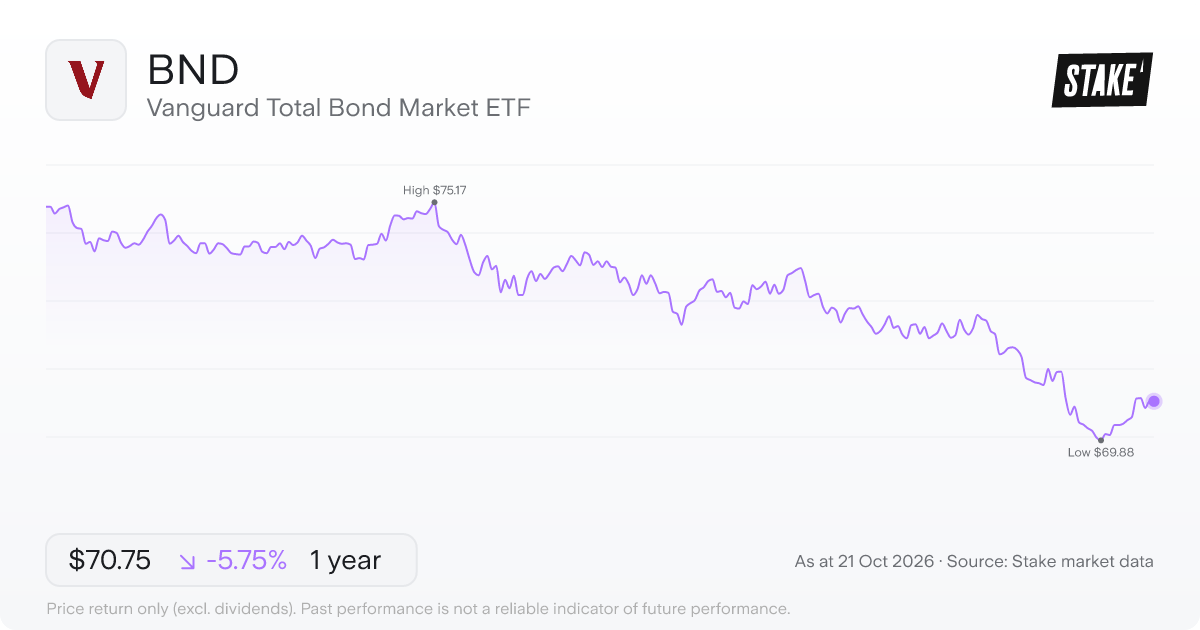
Price: US$70.75 · Daily: 0.0% · AUM: US$161.44B · MER: 0.03%
Fixed income is the focus for Vanguard Total Bond Market Index Fund ($BND), which aims to track the Bloomberg U.S. Aggregate Float Adjusted Index. That index covers public, investment-grade, taxable fixed income securities across the U.S., all with maturities of more than one year. The index is market-weighted, so larger bond issues carry more weight in the portfolio than smaller ones.
4. Vanguard Emerging Markets Stock Index Fund ($VWO)
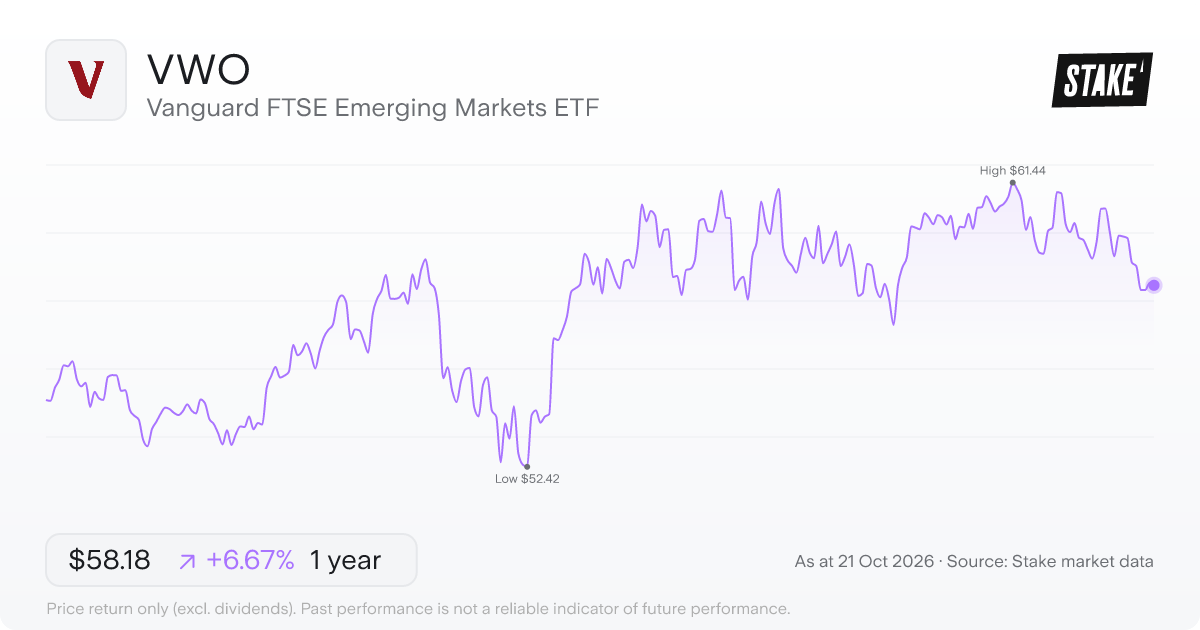
Price: US$58.18 · Daily: -0.1% · AUM: US$125.42B · MER: 0.07%
Vanguard Emerging Markets Stock Index Fund ($VWO) is designed to track the FTSE Emerging Markets All Cap China A Inclusion Index. That index measures the performance of stocks issued by companies located in emerging market countries.
$VWO uses a sampling approach to replicate the index rather than holding every constituent outright. The all-cap construction means the index covers companies of varying sizes across those markets, not just the largest names.
5. Invesco NASDAQ 100 ETF ($QQQM)
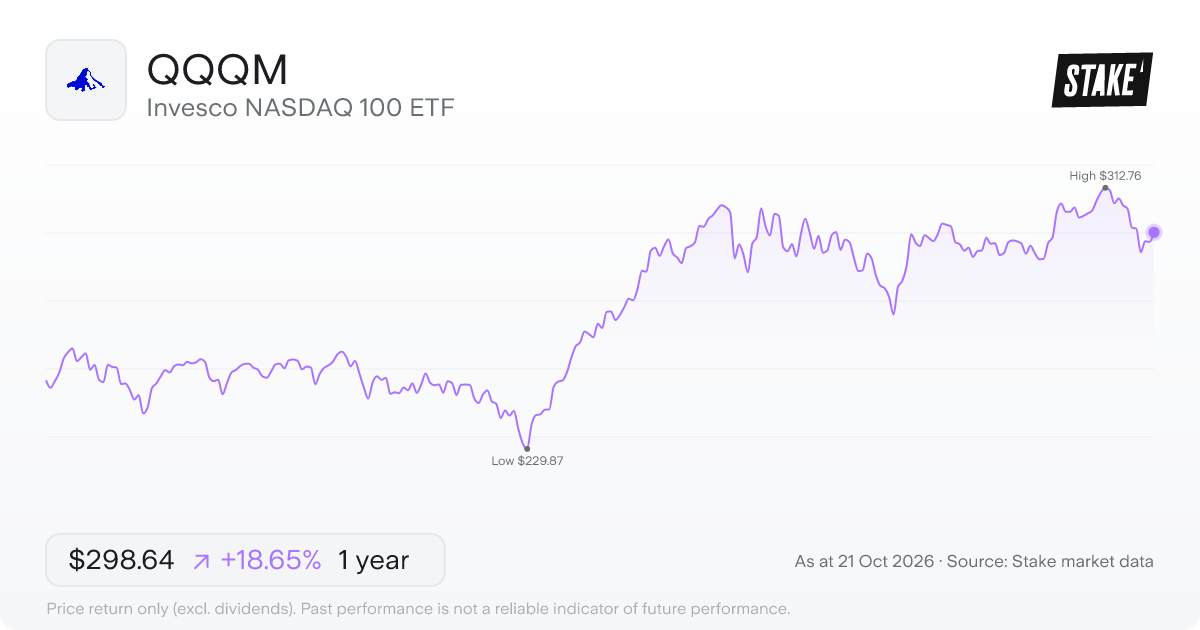
Price: US$298.64 · Daily: 1.0% · AUM: US$108.49B · MER: 0.15%
Invesco NASDAQ 100 ETF ($QQQM) aims to track the Nasdaq-100 Index, which covers 100 of the largest non-financial companies listed on the Nasdaq exchange. The fund invests at least 90% of its assets directly in those index securities. Technology names tend to dominate the index by market capitalisation, though it also includes companies from other sectors.
The MER is 0.15% annually. $QQQM is a concentrated bet on large-cap growth – with 100 holdings rather than the broader sweep of a total-market fund, sector swings in the index will be felt more directly in the fund's returns.
Join 1M+ on Stake
Effortless investing in U.S. shares & ETFs
6. iShares Russell 2000 ETF ($IWM)
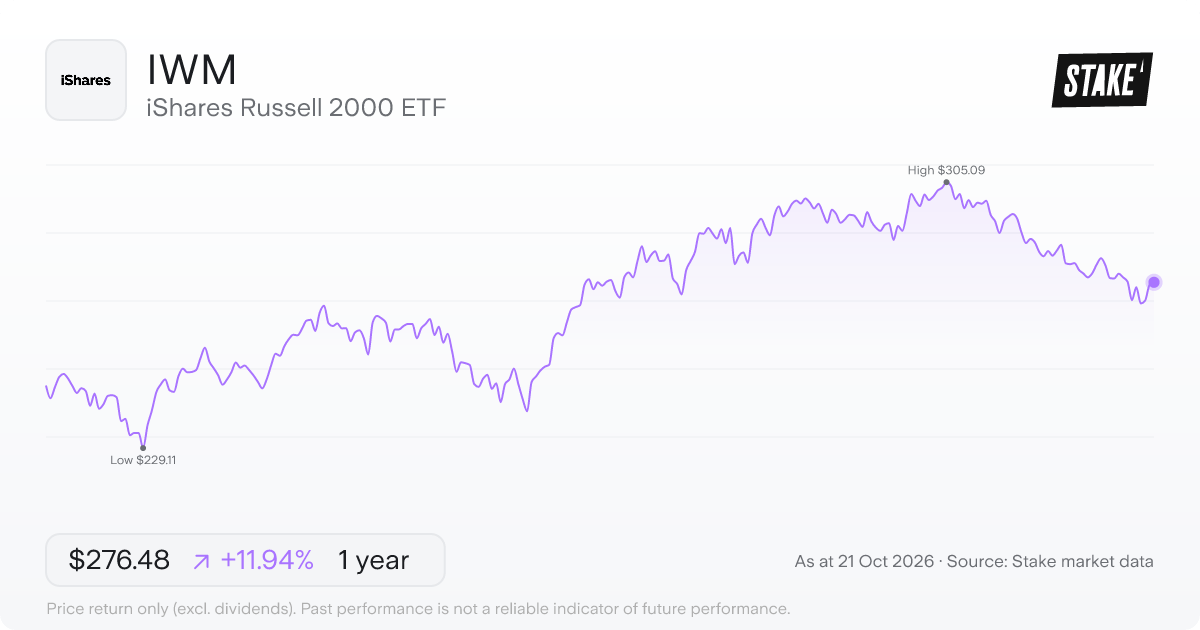
Price: US$276.48 · Daily: 0.3% · AUM: US$75.14B · MER: 0.19%
Small-cap U.S. equities are the focus of the iShares Russell 2000 ETF ($IWM), which is designed to track the Russell 2000 Index. That index covers smaller U.S. companies sitting below the large-cap threshold – a different market segment from the large-cap names tracked by funds like State Street SPDR S&P 500 ETF Trust ($SPY). The fund aims to mirror the index's price and yield performance, before fees and expenses are applied.
7. Vanguard FTSE All World ex US ETF ($VEU)
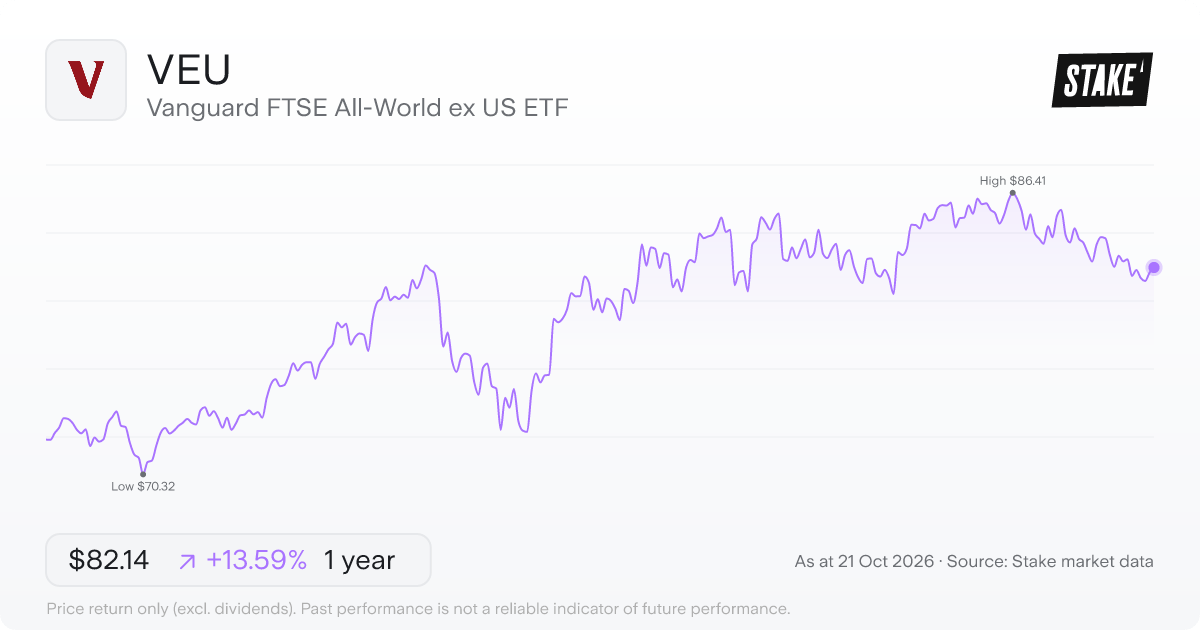
Price: US$82.14 · Daily: 0.4% · AUM: US$68.15B · MER: 0.05%
Vanguard FTSE All World ex US ETF ($VEU) is designed to track the FTSE All-World ex US Index, which covers stocks in developed and emerging markets outside the United States. The fund aims to mirror the performance of that benchmark through an indexing approach rather than active stock selection.
With a 0.05% annual fee and $68.43B in assets under management, $VEU offers exposure to a wide range of international markets in a single holding. For investors already covered on U.S. equities elsewhere, it represents a way to access the rest of the world through one fund.
8. State Street SPDR Dow Jones Indust Avg ETF Trust ($DIA)
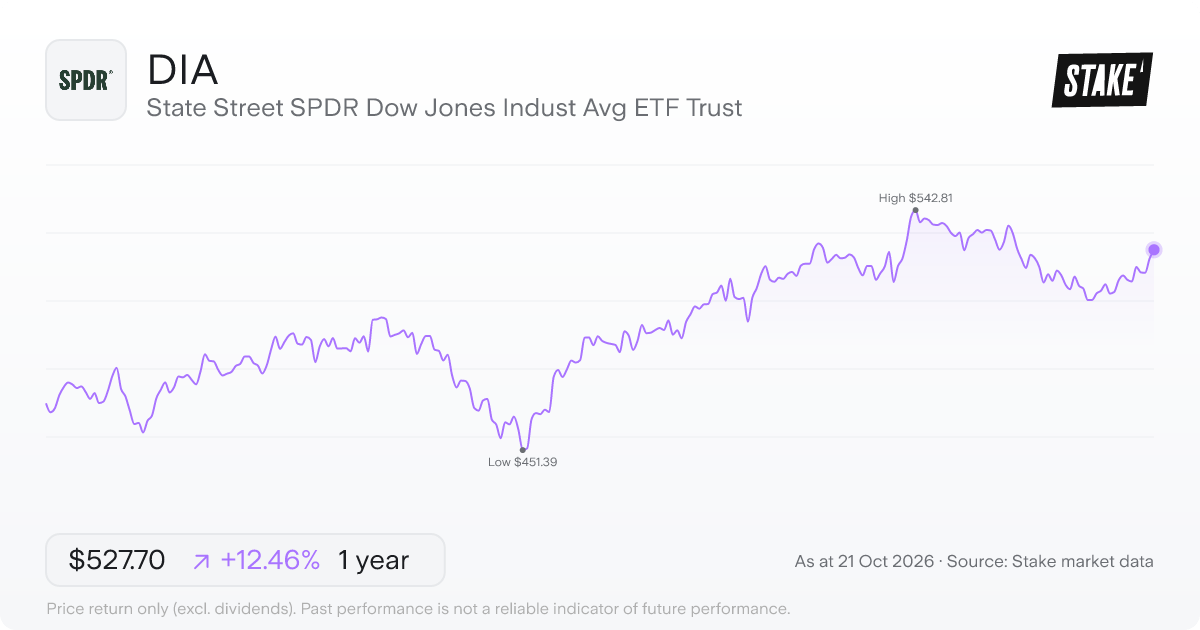
Price: US$527.70 · Daily: 0.6% · AUM: US$45.00B · MER: 0.16%
The Dow Jones Industrial Average covers 30 large U.S. companies, making it one of the most recognisable equity benchmarks in American markets. State Street SPDR Dow Jones Industrial Average ETF Trust ($DIA) aims to match the price and yield performance of that index before expenses. The fund holds the common stocks that make up the DJIA, weighted in accordance with the terms of the Trust Agreement.
9. Vanguard Real Estate Index Fund ($VNQ)
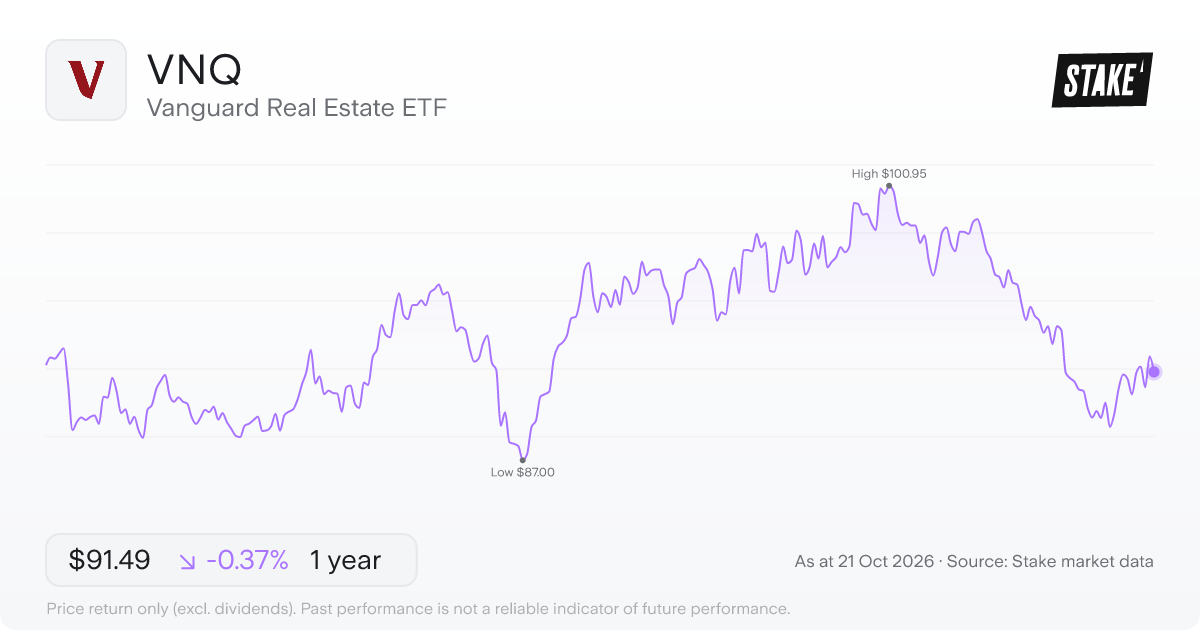
Price: US$91.49 · Daily: -0.9% · AUM: US$35.95B · MER: 0.12%
Vanguard Real Estate Index Fund ($VNQ) tracks an index of publicly traded equity real estate investment trusts (REITs) and other real estate-related investments. REITs are companies that own and operate income-producing property, and U.S. law requires them to distribute most of their taxable income as dividends. The fund is designed to mirror that benchmark's performance through an indexing approach rather than selecting individual securities.
According to its mandate, $VNQ aims to deliver a high level of income alongside moderate long-term capital appreciation. The portfolio concentrates on listed real estate rather than covering the broad U.S. equity market, which makes it sector-specific in a way most equity index funds in this list are not.
10. iShares iBoxx $ High Yield Corporate Bond ETF ($HYG)
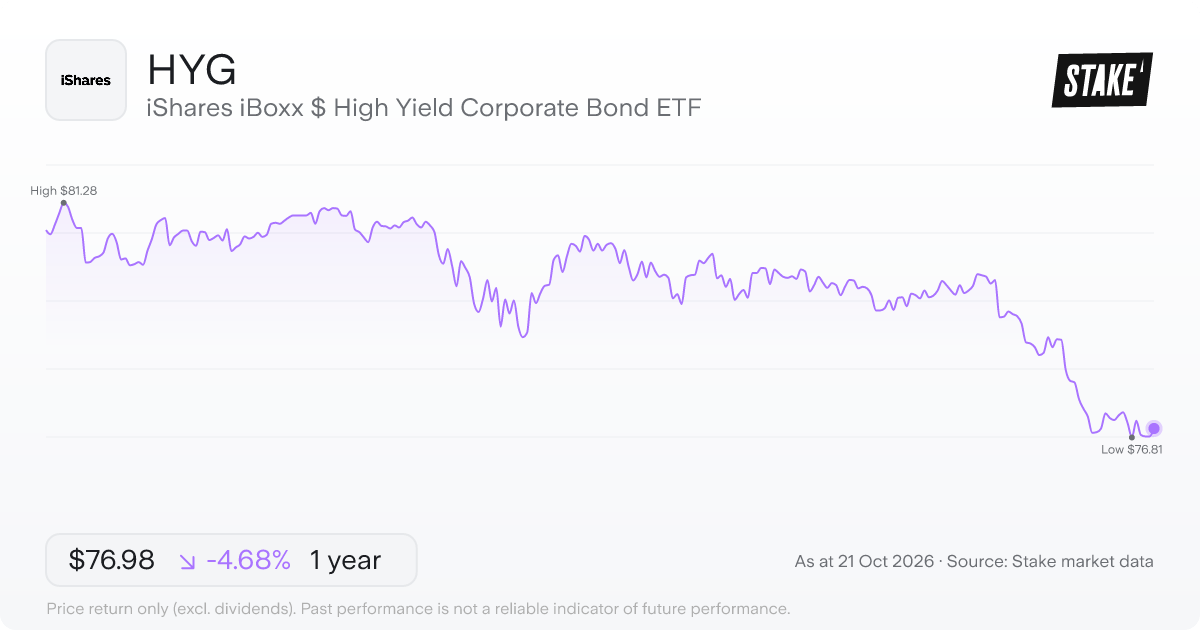
Price: US$76.98 · Daily: 0.2% · AUM: US$16.20B · MER: 0.49%
iShares iBoxx $ High Yield Corporate Bond ETF ($HYG) aims to track the Markit iBoxx USD Liquid High Yield Index, which covers US dollar-denominated corporate bonds rated below investment grade. That rating category – often called high yield or junk – means the issuing companies carry more credit risk than governments or blue-chip corporates, and the bonds are priced to reflect that.
The fund puts at least 90% of its assets into the index's component bonds and may hold up to 10% in futures. Its MER of 0.49% sits at the higher end of the funds in this list, which is common for fixed income strategies that cover less liquid bond markets. For investors watching the corporate credit market, $HYG offers a single-trade way to access a broad slice of it.
➡️ Top 10 low-cost ETFs to watch in 2026→
Common questions
How do I invest in U.S. index funds in Australia?
Every fund in this list trades on U.S. exchanges in U.S. dollars, so you'll need a trading platform that offers U.S. market access – Stake is one option. You search by ticker, place an order during U.S. market hours, and settlement happens in USD. Converting AUD to USD is part of the process, and that conversion means the AUD/USD rate is a factor from the moment you buy.
What are the key risks of U.S. index funds?
Market risk is the most direct one for equity funds – when an index falls, the fund follows it down, with no active manager stepping in to reduce exposure. All ten funds here are priced in USD, so the AUD/USD exchange rate is an additional consideration for Australian investors; none of these funds are hedged against that movement. Bond funds carry interest rate sensitivity, with prices generally moving inversely to rates. $HYG's high-yield focus adds credit risk from lower-rated borrowers, and $VWO's emerging markets exposure brings political and liquidity risks that funds focused on developed markets don't carry to the same degree.
This list includes equity, bond and real estate funds – how do they differ?
The equity funds here hold shares in companies, so their value moves with those companies' fortunes. $BND and $HYG track debt markets instead – they hold bonds rather than ownership stakes, and their prices respond more directly to interest rate movements ($HYG adds credit risk on top, given its focus on lower-rated borrowers). $VNQ tracks real estate investment trusts, or REITs, which are structures required to distribute most of their taxable income as dividends. Each category carries a distinct risk and income profile, and this list covers all three.
More resources
✅ Top 10 ASX index funds to watch in 2026→
Disclaimer
Past performance is not a reliable indicator of future performance. When you invest, your capital is at risk. You should consider your own investment objectives, financial situation, and particular needs before making an investment decision. The value of your investments can go down as well as up and you may receive back less than your original investment. As always, do your own research and consider seeking appropriate financial advice before investing.
This is not personal financial advice nor a recommendation to invest in the securities listed. Any advice provided by Stake is of general nature only and does not take into account your specific circumstances. Trading and volume data from the Stake investing platform is for reference purposes only, the investment choices of others may not be appropriate for your needs and is not a reliable indicator of performance.
Please refer to hellostake.com/pricing for the fees that apply. When you trade securities priced in another currency, currency conversion fees may apply and movements in the exchange rate may affect your returns.

Stake Desk
The freshest market insights
This article combines AI and human review from our analysts to bring you accurate, informative investing content at speed. For questions or suggestions, contact stakedesk@stake.com.au.
Subscribe
By subscribing, you agree to our Privacy Policy.