
The Nasdaq-100 covers the exchange's 100 largest non-financial companies, and most of these funds track a version of it.
Nasdaq ETFs track indices built from companies listed on the Nasdaq Stock Market, most often the Nasdaq-100, which ranks the exchange's largest non-financial companies by market cap. $QQQ and $QQQM both track that index at 0.20% and 0.15%, while the others here weight it equally, write covered calls over it or strip out the technology names.
How we built this list: We selected these funds based on their industry or investment category and ordered them by assets under management. Prices are updated daily, and the list and supporting content are reviewed roughly every quarter. All data is sourced from Stake. This list isn't a recommendation and isn't ordered by suitability.
ETF Name | Ticker | Share Price | AUM | Expense Ratio | In Watchlists |
|---|---|---|---|---|---|
Invesco QQQ Trust, Series 1 | $704.47 | $489.57B | 0.20% | 30727 | |
Invesco NASDAQ 100 ETF | $290.13 | $109.95B | 0.15% | 11616 | |
Fidelity NASDAQ Composite Index ETF | $102.51 | $10.98B | 0.21% | 414 | |
Global X NASDAQ 100 Covered Call ETF | $18.07 | $8.41B | 0.60% | 2859 | |
First Trust NASDAQ-100 Select Equal Weight ETF | $155.02 | $1.86B | 0.57% | 121 | |
Direxion NASDAQ-100 Equal Weighted Index ETF | $117.63 | $1.43B | 0.35% | 347 | |
Invesco NASDAQ Next Gen 100 ETF | $44.29 | $1.19B | 0.15% | 634 | |
Invesco Nasdaq Internet ETF | $51.99 | $547.5M | 0.60% | 126 | |
First Trust NASDAQ-100 Ex-Technology Sector Idx Fd | $100.16 | $134.8M | 0.58% | 4 |
Past performance is not a reliable indicator of future performance.
Source: Stake market data. Figures in US$. Data updated as of 22 October 2026.
✅ Learn more: Top 10 U.S.-listed index funds to watch in 2026→
Sign up in minutes and get access to a CHESS-sponsored platform, where you can explore Nasdaq ETFs and more.
1. Invesco QQQ Trust, Series 1 ($QQQ)
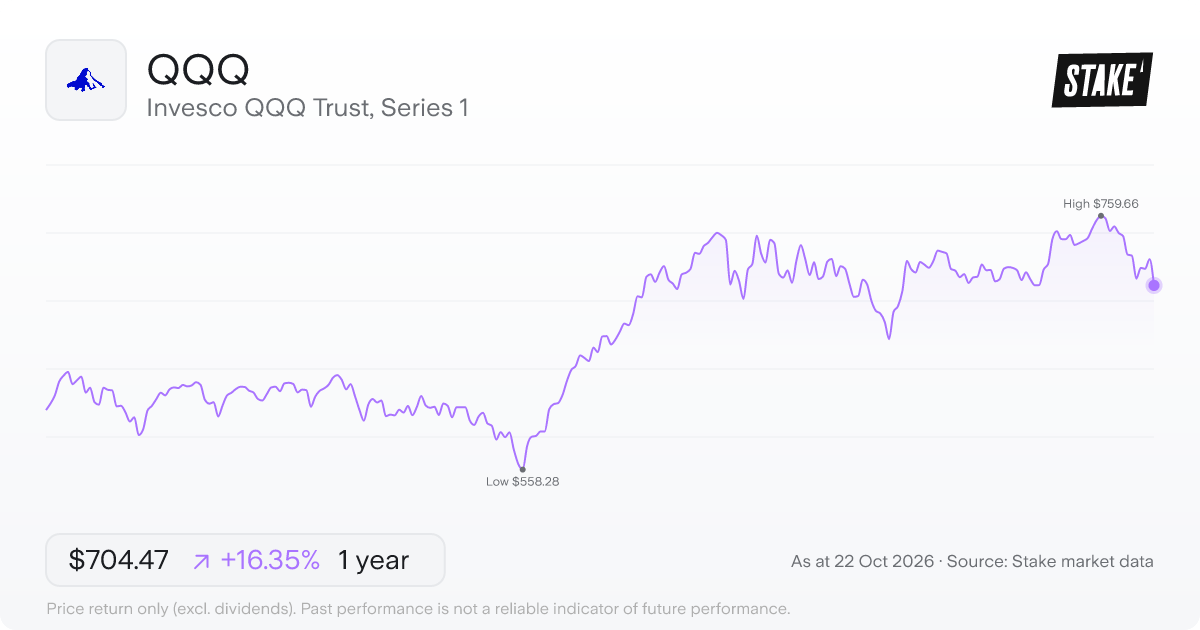
Price: US$704.47 · Daily: -2.9% · AUM: US$489.57B · MER: 0.20%
Invesco QQQ Trust, Series 1 ($QQQ) is designed to track the Nasdaq-100 Index, which covers 100 of the largest non-financial companies listed on the Nasdaq Stock Market by market capitalisation. That non-financial screen explicitly excludes banks and insurers from the index, which shapes its overall composition.
The index draws from both U.S.-headquartered companies and international names listed on Nasdaq, so domicile alone doesn't determine eligibility. Weighting runs by market cap, meaning larger companies take up a proportionally bigger slice of the portfolio. When relative sizes shift enough, the index rebalances to reflect the updated rankings.
2. Invesco NASDAQ 100 ETF ($QQQM)
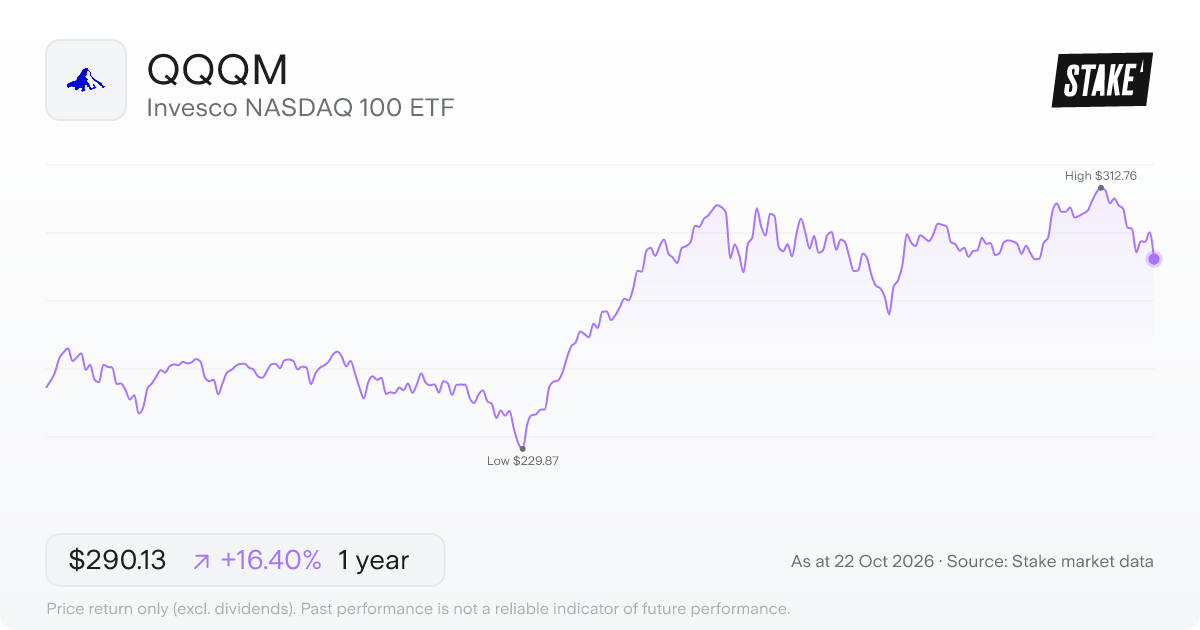
Price: US$290.13 · Daily: -2.8% · AUM: US$109.95B · MER: 0.15%
Invesco NASDAQ 100 ETF ($QQQM) is designed to track the Nasdaq-100 Index, which covers 100 of the largest non-financial companies listed on the Nasdaq Stock Market by market capitalisation. That non-financial screen is baked into the index's construction – banks and other financial firms are excluded from the start. Because the index is weighted by market cap, the biggest companies carry the most influence over how $QQQM moves.
At least 90% of the fund's assets are intended to be held directly in the index constituents. The index includes both U.S.-domiciled and international companies, so the holdings aren't confined to American names.
3. Fidelity NASDAQ Composite Index ETF ($ONEQ)
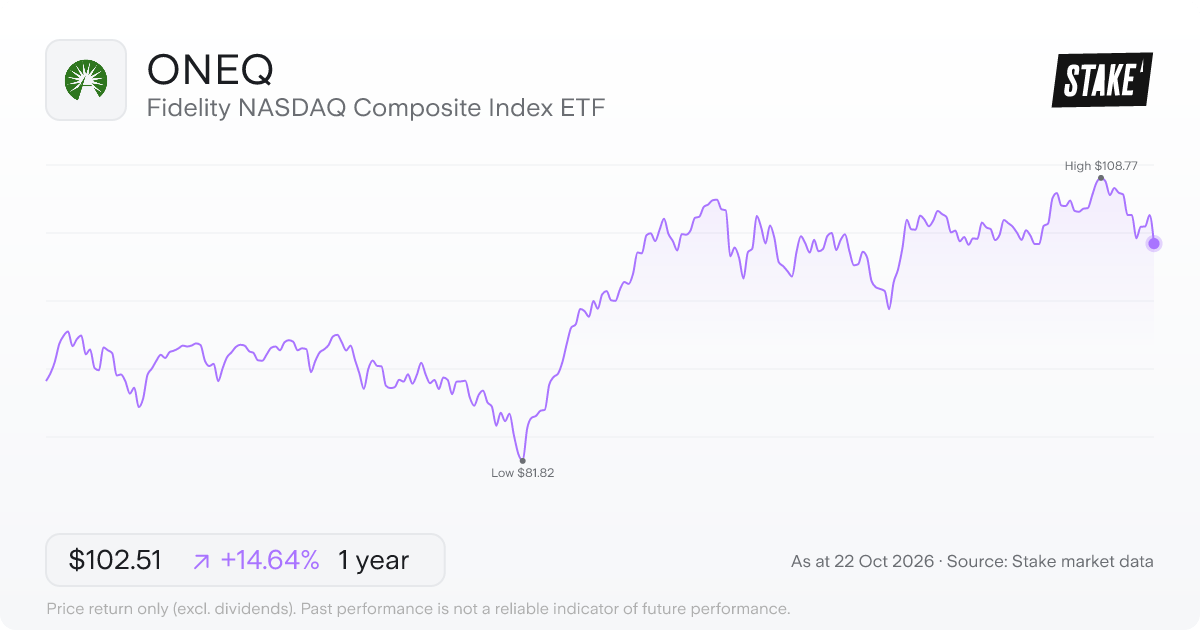
Price: US$102.51 · Daily: -2.6% · AUM: US$10.98B · MER: 0.21%
The Nasdaq Composite Index covers a wider universe than the more commonly referenced Nasdaq-100 – drawing in essentially all common stocks listed on the Nasdaq exchange, across every sector, rather than just the top 100 non-financial names. Fidelity NASDAQ Composite Index ETF ($ONEQ) is designed to match that index's price and yield performance by holding common stocks drawn from it. Because the full index runs to thousands of names, $ONEQ uses statistical sampling techniques to replicate those returns rather than buying every constituent outright.
4. Global X NASDAQ 100 Covered Call ETF ($QYLD)
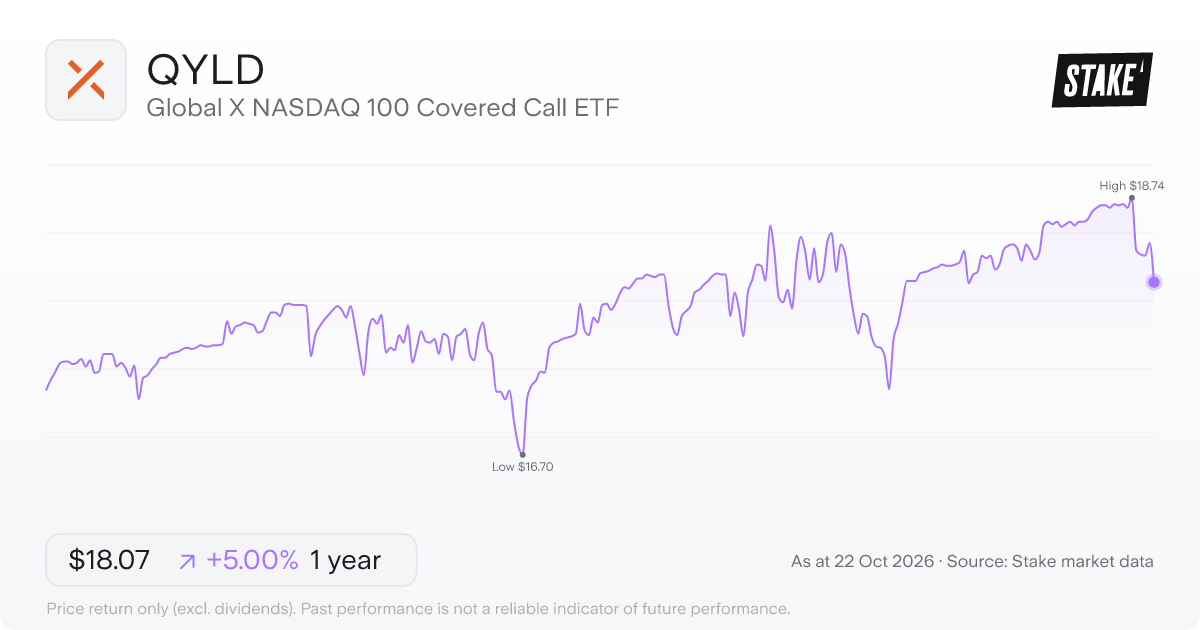
Price: US$18.07 · Daily: -1.7% · AUM: US$8.41B · MER: 0.60%
Built around the CBOE NASDAQ-100 BuyWrite Index, Global X NASDAQ 100 Covered Call ETF ($QYLD) combines a position in Nasdaq-100 stocks with a programme of writing (selling) call options against those holdings. The replication approach means $QYLD aims to hold at least 80% of its assets in the common stocks that make up that index. Selling those options generates premiums, but it also limits how much the fund can participate if the underlying stocks rally strongly.
Join 1M+ on Stake
Effortless investing in U.S. shares & ETFs
5. First Trust NASDAQ-100 Select Equal Weight ETF ($QQEW)
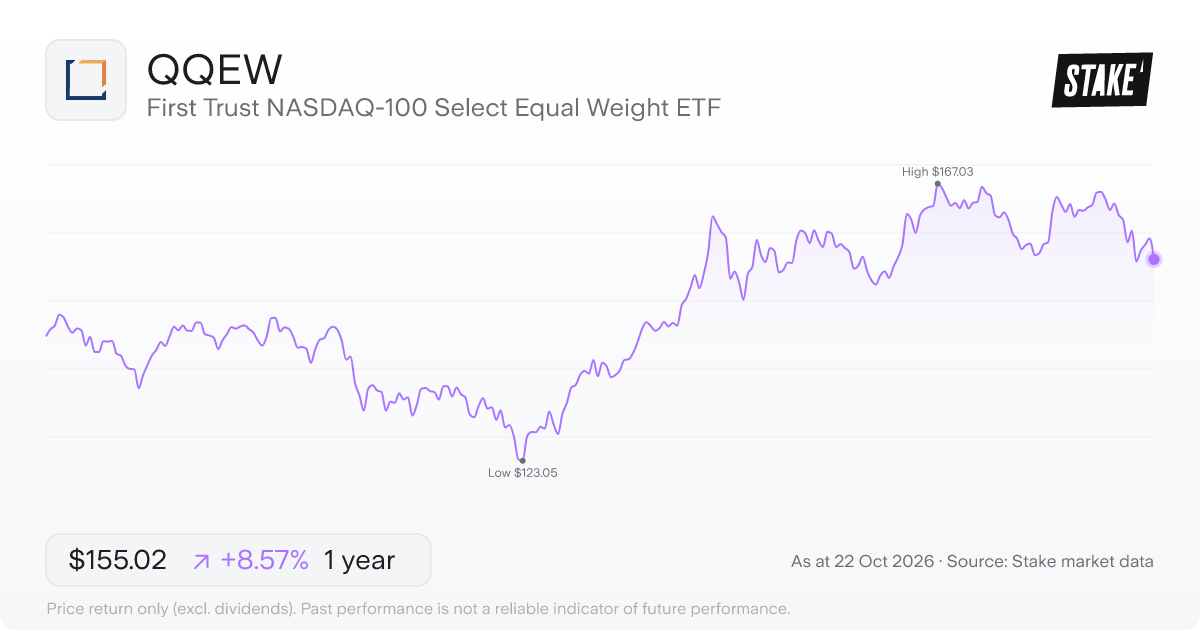
Price: US$155.02 · Daily: -2.1% · AUM: US$1.86B · MER: 0.57%
Rather than holding all 100 companies in the Nasdaq-100, First Trust NASDAQ-100 Select Equal Weight ETF ($QQEW) tracks an index built from the top 50 by a combined quality and growth score. Equal weighting means each position carries the same proportion in the portfolio, rather than letting the largest companies by market cap absorb most of the exposure. The fund aims to correspond generally to the price and yield of that more concentrated, equally distributed index.
6. Direxion NASDAQ-100 Equal Weighted Index ETF ($QQQE)
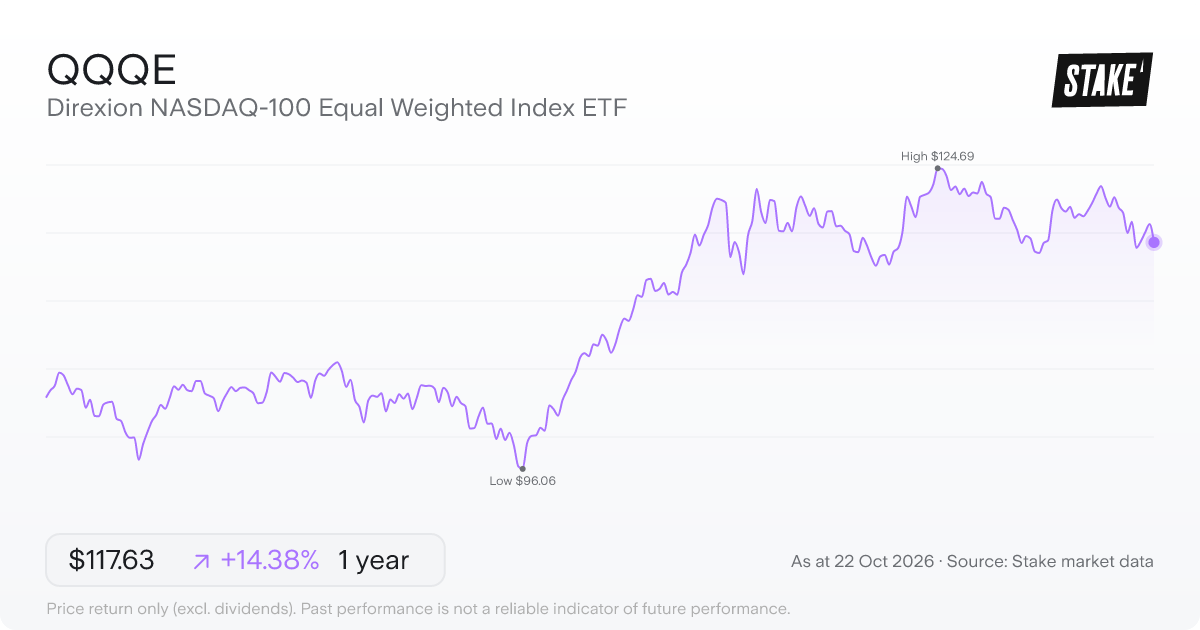
Price: US$117.63 · Daily: -1.5% · AUM: US$1.43B · MER: 0.35%
The Direxion NASDAQ-100 Equal Weighted Index ETF ($QQQE) is designed to track the NASDAQ-100 Equal Weighted Index, which covers 100 of the largest domestic and international non-financial companies listed on the Nasdaq Stock Market. The equal-weighted structure means each company in the index is assigned roughly the same weight, rather than letting the biggest names by market capitalisation dominate the portfolio.
That construction contrasts with the standard Nasdaq-100, where a handful of the largest companies can account for a substantial share of the overall exposure. $QQQE holds assets of $1.42B and carries a management expense ratio of 0.35%.
7. Invesco NASDAQ Next Gen 100 ETF ($QQQJ)
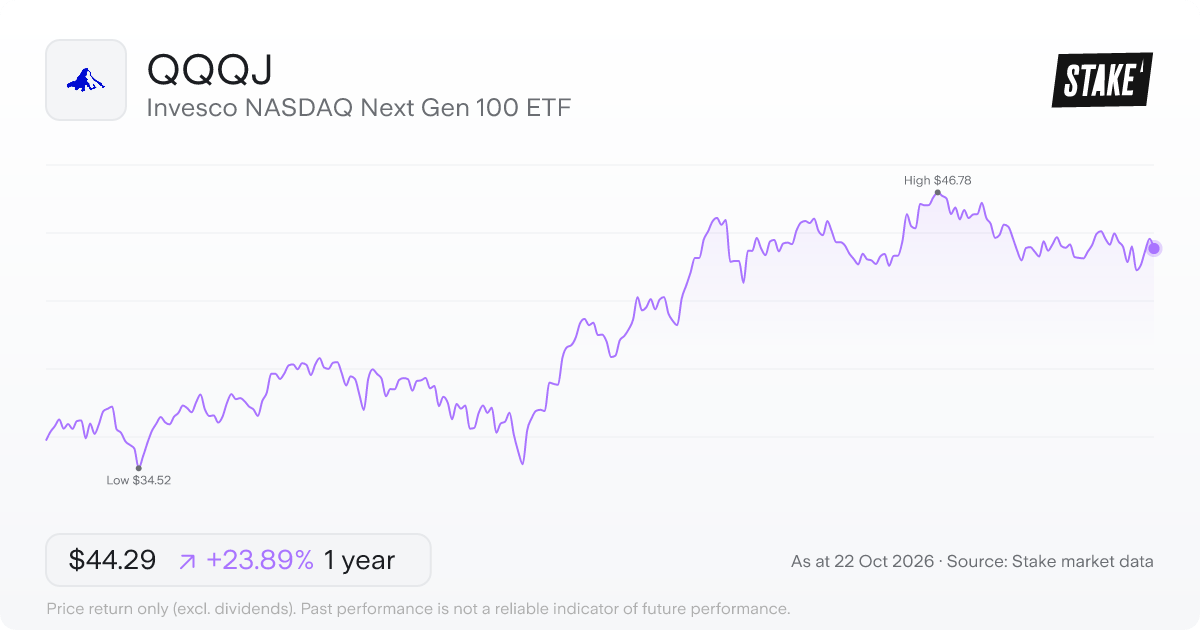
Price: US$44.29 · Daily: -1.0% · AUM: US$1.19B · MER: 0.15%
Invesco NASDAQ Next Gen 100 ETF ($QQQJ) aims to track the NASDAQ Next Generation 100 Index, which covers the 100 largest Nasdaq-listed companies sitting just outside the Nasdaq-100. These are names that have grown large enough to rank among the top tier of the exchange, but haven't yet displaced the companies in the headline index.
The fund is designed to invest at least 90% of its assets in the securities that make up that underlying index. With an MER of 0.15% and $1.18B in assets under management, it holds a focused mandate – one tier below the Nasdaq-100, rather than the broad Nasdaq market as a whole.
8. Invesco Nasdaq Internet ETF ($PNQI)
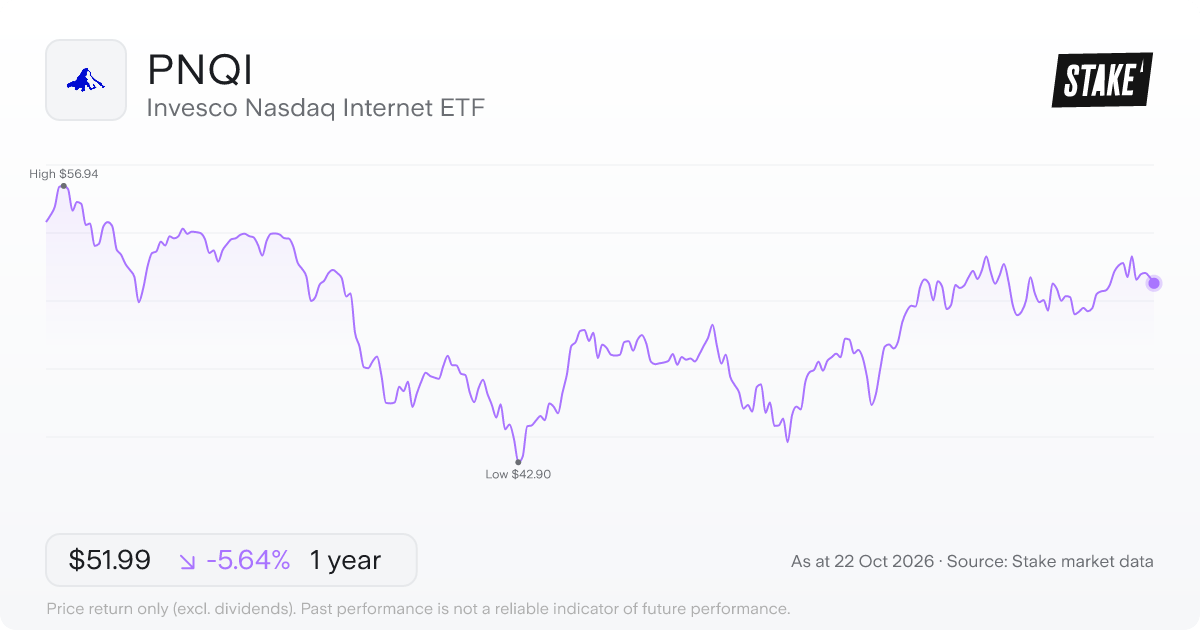
Price: US$51.99 · Daily: -0.6% · AUM: US$547.5M · MER: 0.60%
The Invesco Nasdaq Internet ETF ($PNQI) focuses its portfolio on common stocks of internet companies. Its mandate requires at least 80% of total assets in that category. A separate threshold then requires at least 90% of assets to sit in the stocks that make up its underlying index.
That layered construction keeps the portfolio tightly anchored to its benchmark. $PNQI targets a specific slice of the Nasdaq defined by internet business activity, rather than the exchange's full breadth. The underlying index determines which companies qualify, and the fund aims to replicate that composition closely.
9. First Trust NASDAQ-100 Ex-Technology Sector Idx Fd ($QQXT)
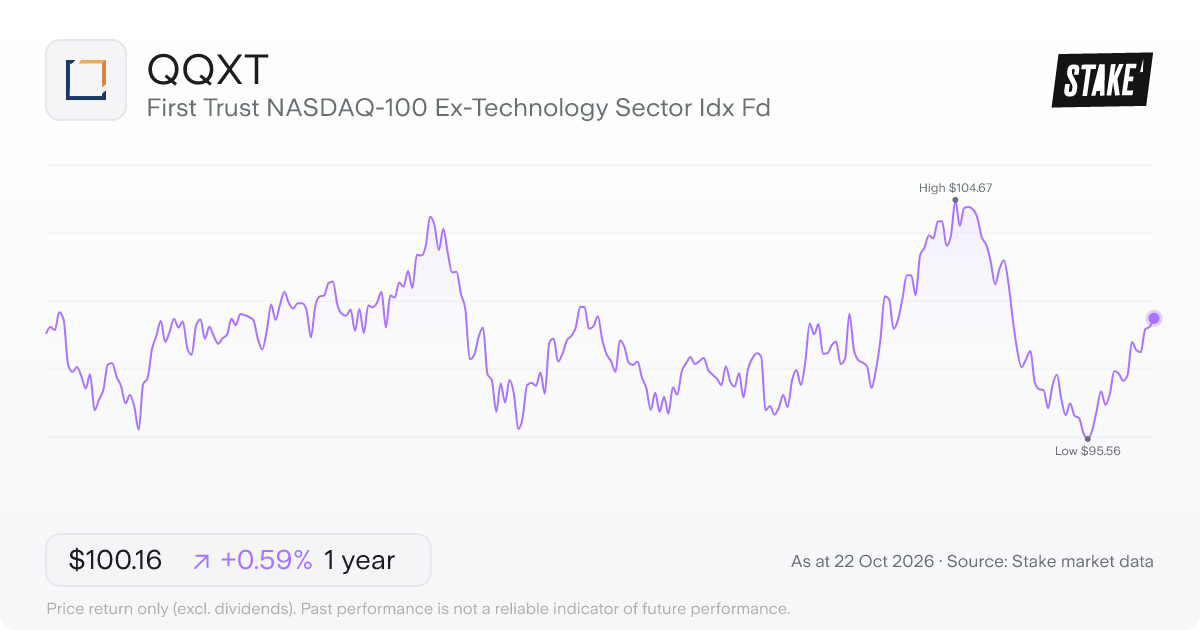
Price: US$100.16 · Daily: 0.3% · AUM: US$134.8M · MER: 0.58%
First Trust NASDAQ-100 Ex-Technology Sector Idx Fd ($QQXT) tracks the NASDAQ-100 Ex-Tech Sector Index, which is built from NASDAQ-100 constituents that aren't classified as technology. The result is a slice of the NASDAQ-100 with the tech names stripped out, leaving sectors like healthcare, consumer discretionary and industrials to do the work.
The index is equal-weighted, so each holding is given roughly the same allocation rather than letting the largest companies crowd out the rest. That construction means the fund's behaviour can diverge noticeably from the broader NASDAQ-100, which tilts heavily toward its biggest names. The MER is 0.58%.
$QQXT carries an AUM of $159.0M. For investors tracking what the NASDAQ-100 looks like without its technology layer, the fund offers a direct way to access that specific slice of the index.
➡️ Top 10 low-cost ETFs to watch in 2026→
Common questions
How do I invest in Nasdaq ETFs in Australia?
All nine funds in this list trade on U.S. exchanges, so you'll need a share trading platform with U.S. market access to buy them. They trade in USD during U.S. market hours, like any other U.S.-listed security. Because they're priced in USD, movements in the AUD/USD rate affect the value of your holding in Australian dollar terms, even when the underlying index hasn't moved.
What are the key risks of Nasdaq ETFs?
The Nasdaq-100 is heavily weighted toward large technology and technology-adjacent companies, so these funds tend to be more sensitive to tech sector swings than a broad market index would be. Currency exposure adds another layer – with all nine funds priced in USD, a rising Australian dollar reduces the AUD value of your position regardless of how the index performs. Funds using more complex strategies, like the covered call approach in $QYLD, carry additional structural risk: an options overlay can limit how much the fund participates when the market rises sharply.
What's the difference between the Nasdaq-100 and the Nasdaq Composite?
The Nasdaq-100 holds the 100 largest non-financial companies listed on Nasdaq, weighted by market capitalisation. The Nasdaq Composite covers a much broader universe – essentially all companies listed on the exchange, including smaller and mid-cap names well outside the top 100. Most funds in this list are built around the Nasdaq-100 or a variant of it; $ONEQ tracks the Composite instead, which means its holdings extend well beyond the mega-cap names that dominate the Nasdaq-100.
What's the difference between market-cap weighted and equal-weighted Nasdaq ETFs?
In a market-cap weighted fund, the largest companies by market value hold the biggest positions – a small number of very large names can end up driving most of the fund's movement. Equal-weighted approaches give each company in the index a similar allocation, which reduces how much any single name influences performance. $QQEW and $QQQE both use equal weighting, though they track different versions of the Nasdaq-100, so their holdings aren't identical. The two approaches will diverge noticeably when the largest Nasdaq-100 names move differently from the rest of the index.
More resources
✅ Top 10 technology ETFs in Australia to watch in 2026→
Disclaimer
Past performance is not a reliable indicator of future performance. When you invest, your capital is at risk. You should consider your own investment objectives, financial situation, and particular needs before making an investment decision. The value of your investments can go down as well as up and you may receive back less than your original investment. As always, do your own research and consider seeking appropriate financial advice before investing.
This is not personal financial advice nor a recommendation to invest in the securities listed. Any advice provided by Stake is of general nature only and does not take into account your specific circumstances. Trading and volume data from the Stake investing platform is for reference purposes only, the investment choices of others may not be appropriate for your needs and is not a reliable indicator of performance.
Please refer to hellostake.com/pricing for the fees that apply. When you trade securities priced in another currency, currency conversion fees may apply and movements in the exchange rate may affect your returns.

Stake Desk
The freshest market insights
This article combines AI and human review from our analysts to bring you accurate, informative investing content at speed. For questions or suggestions, contact stakedesk@stake.com.au.
Subscribe
By subscribing, you agree to our Privacy Policy.