Top US insurance stocks to watch in 2026

State regulators control premium rate changes for U.S. insurers. Their approval determines how fast companies can reprice when claims outrun premiums.
U.S. insurance companies take on risk on behalf of businesses and individuals – collecting premiums and paying out claims across auto, home, commercial property, liability and more. The ten names on this list range from broad personal and commercial insurers to more specialised operations. Markel Group ($MKL) is structured as a holding company that reaches well beyond insurance into industrial manufacturing and consumer businesses. Assurant ($AIZ) takes a different approach, partnering with consumer brands to protect mobile devices, vehicles and homes rather than underwriting traditional policies.
How we built this list: We selected these companies based on their industry and ordered them by market capitalisation. Prices are updated daily, and the list and supporting content are reviewed roughly every quarter. All data is sourced from Stake. This list isn't a recommendation and isn't ordered by suitability.
Company Name | Ticker | Share Price | Market Cap | In Watchlists |
|---|---|---|---|---|
Travelers | $385.45 | $79.00B | 188 | |
Allstate | $246.85 | $62.68B | 226 | |
AIG | $80.66 | $42.18B | 258 | |
Arch Capital Group | $100.48 | $34.56B | 111 | |
Cincinnati Financial | $169.89 | $26.28B | 115 | |
W. R. Berkley | $74.08 | $28.00B | 95 | |
Markel Group | $1,855.84 | $22.92B | 498 | |
Assurant | $280.56 | $13.97B | 44 | |
CNA Financial | $47.83 | $12.96B | 21 | |
American Financial Group | $148.08 | $12.37B | 63 |
Past performance is not a reliable indicator of future performance.
Source: Stake market data. Figures in US$. Data updated as of 19 October 2026.
✅ Learn more: Top ASX insurance stocks to watch in 2026→
Sign up in minutes and get access to a CHESS-sponsored platform, where you can explore US insurance stocks and more.
1. Travelers ($TRV)
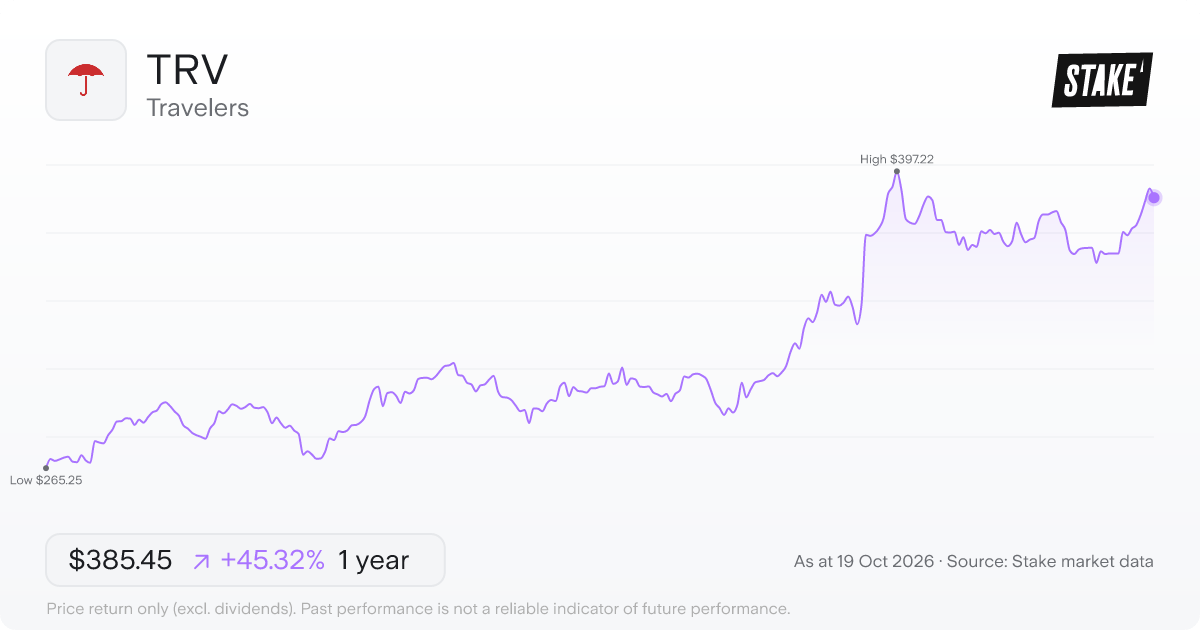
Price: US$385.45 · Daily: -1.0% · Market cap: US$79.00B · Sector: Financials · Industry: Insurance
The Travelers Companies ($TRV) covers the kind of risks that show up in everyday life and in corporate boardrooms alike. Its Business Insurance segment underwrites property and casualty products for commercial customers, primarily in the U.S. but also in the United Kingdom, Republic of Ireland and parts of the world beyond.
The Bond & Specialty Insurance segment takes on a different kind of risk – surety bonds, management liability and professional liability, plus certain specialty products in Canada, the UK, Republic of Ireland and Brazil through a joint venture. Personal Insurance rounds out the business, covering auto and home for individual customers across the U.S.
Alan Schnitzer leads the company, which employs around 34,000 people.
2. Allstate ($ALL)
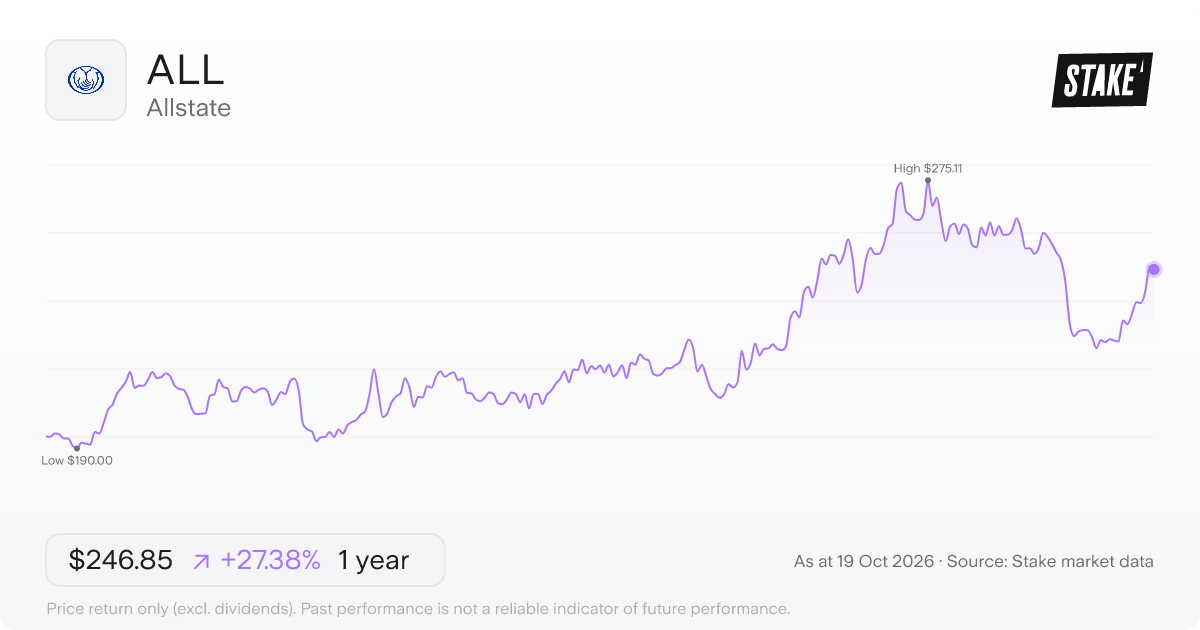
Price: US$246.85 · Daily: -0.4% · Market cap: US$62.68B · Sector: Financials · Industry: Insurance
The Allstate Corporation ($ALL) sells protection across autos, homes, electronic devices and identity theft. Auto and home coverage sit at the core of the business, sold through Allstate's own agents, independent agents, major retailers and online channels.
Beyond traditional policies, $ALL runs a Protection Services arm that covers consumer electronics, vehicle dealer products, roadside assistance and identity protection. That segment operates under several brands, including Allstate Protection Plans and Allstate Roadside. It's a notably different business line from underwriting cars and houses – closer to the warranties and service plans you'd see offered at a retailer checkout.
CEO Tom Wilson leads a company of around 53,000 employees. $ALL also carries a Run-off Property-Liability segment, which holds older property and casualty coverage that's no longer actively written but still generates claims obligations.
3. AIG ($AIG)
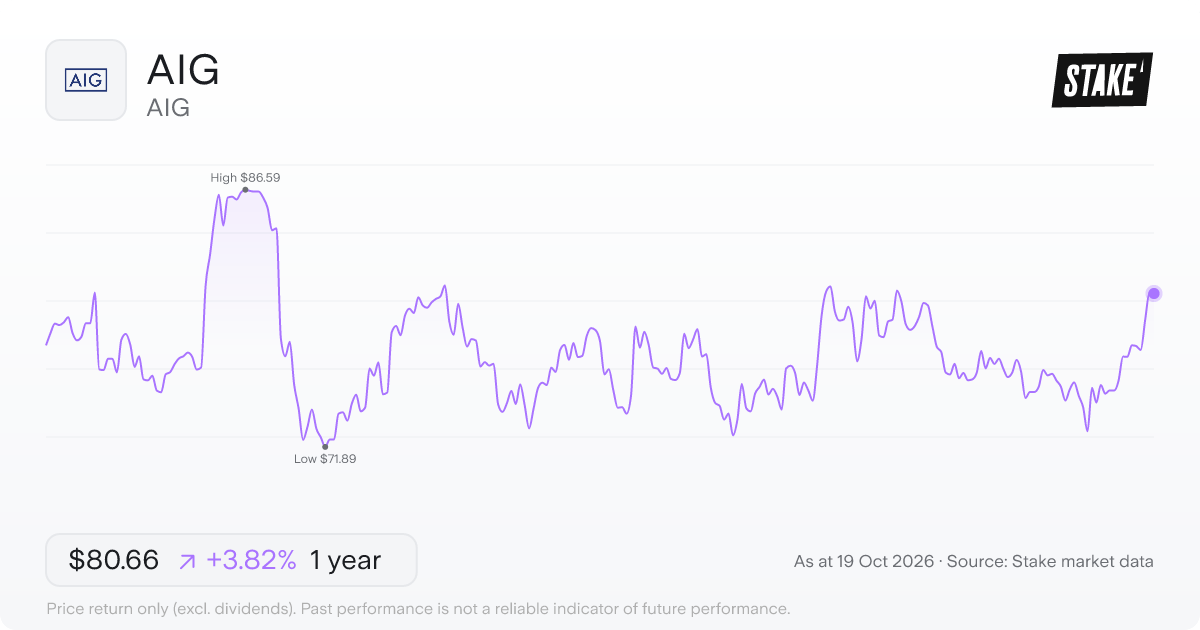
Price: US$80.66 · Daily: -0.10% · Market cap: US$42.18B · Sector: Financials · Industry: Insurance
American International Group ($AIG) underwrites commercial and personal insurance for businesses and individuals in over 200 countries and jurisdictions. The commercial side divides into a North American arm – covering the U.S., Canada and Bermuda – and an international one that reaches Japan, the UK, Europe, the Middle East and Africa, Asia Pacific, Latin America and China. Products across both include property, casualty, financial lines and speciality cover. A third segment handles personal lines and accident and health products globally, with Eric Andersen leading a workforce of 22,100 people.
4. Arch Capital Group ($ACGL)
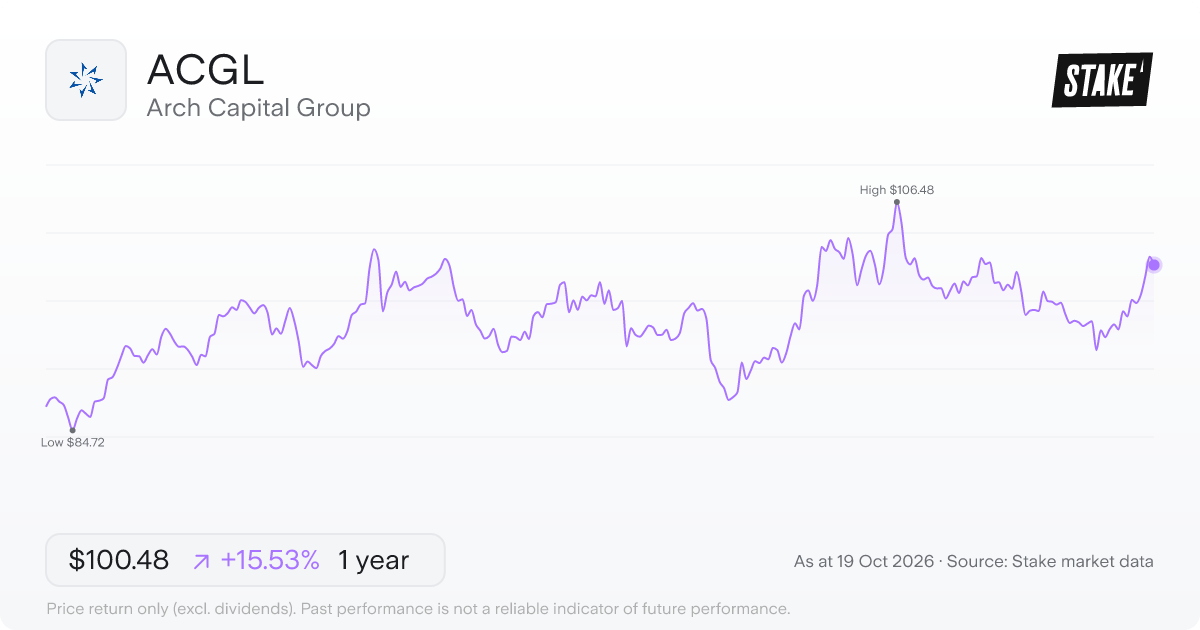
Price: US$100.48 · Daily: -0.8% · Market cap: US$34.56B · Sector: Financials · Industry: Insurance
Arch Capital Group ($ACGL) operates across three distinct areas: insurance, reinsurance, and mortgage insurance. The insurance arm writes specialty lines – think construction liability, aviation, professional indemnity and warranty products. The reinsurance side takes on risk from other insurers across property catastrophe, marine, casualty and life reinsurance. A third leg covers U.S. primary mortgage insurance and credit-risk transfer, which is less common territory for a company of this type.
Under CEO Nicolas Papadopoulo, $ACGL employs around 8,000 people and is headquartered in Bermuda, which is a common base for globally active reinsurers.
5. Cincinnati Financial ($CINF)
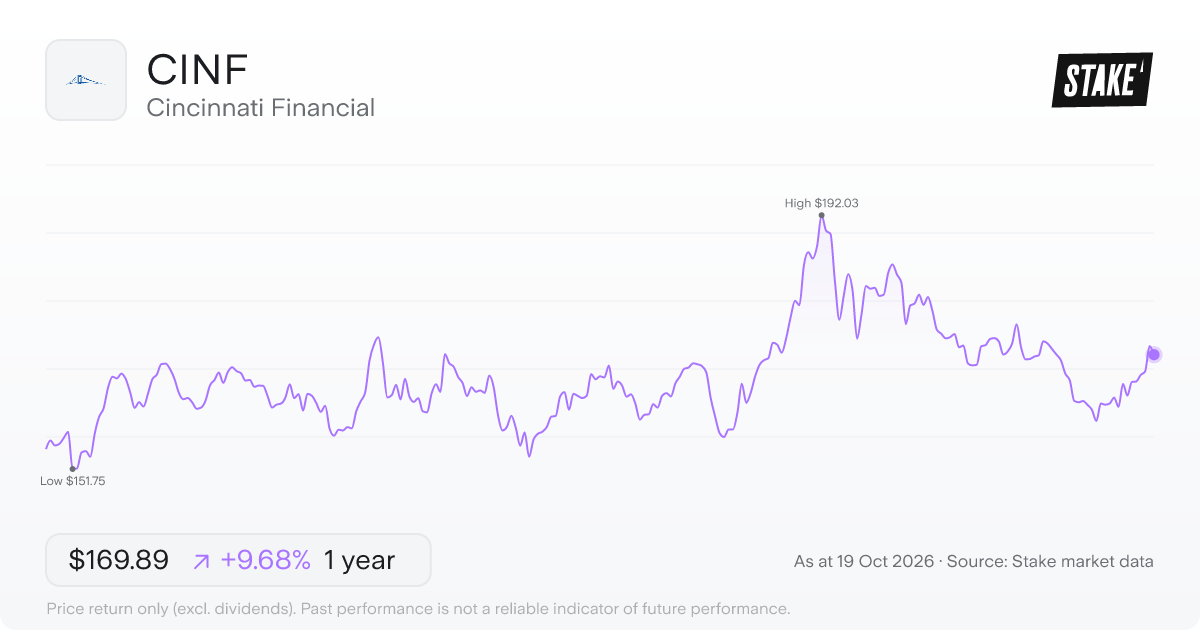
Price: US$169.89 · Daily: -0.8% · Market cap: US$26.28B · Sector: Financials · Industry: Insurance
Cincinnati Financial Corporation ($CINF) runs its core insurance business through The Cincinnati Insurance Company, covering commercial and personal risks across property, casualty, auto and workers' compensation. The life insurance arm adds term, whole and universal life products to the mix, while a dedicated excess and surplus lines segment takes on commercial risks that fall outside standard market appetite.
CEO Steve Spray leads a company of 5,705 employees. The investments segment puts the premium float to work across fixed-maturity securities, equities and short-term instruments – a common structure in insurance that ties the company's financial performance to both underwriting results and investment returns.
Join 1M+ on Stake
Effortless investing in U.S. shares & ETFs
6. W. R. Berkley ($WRB)
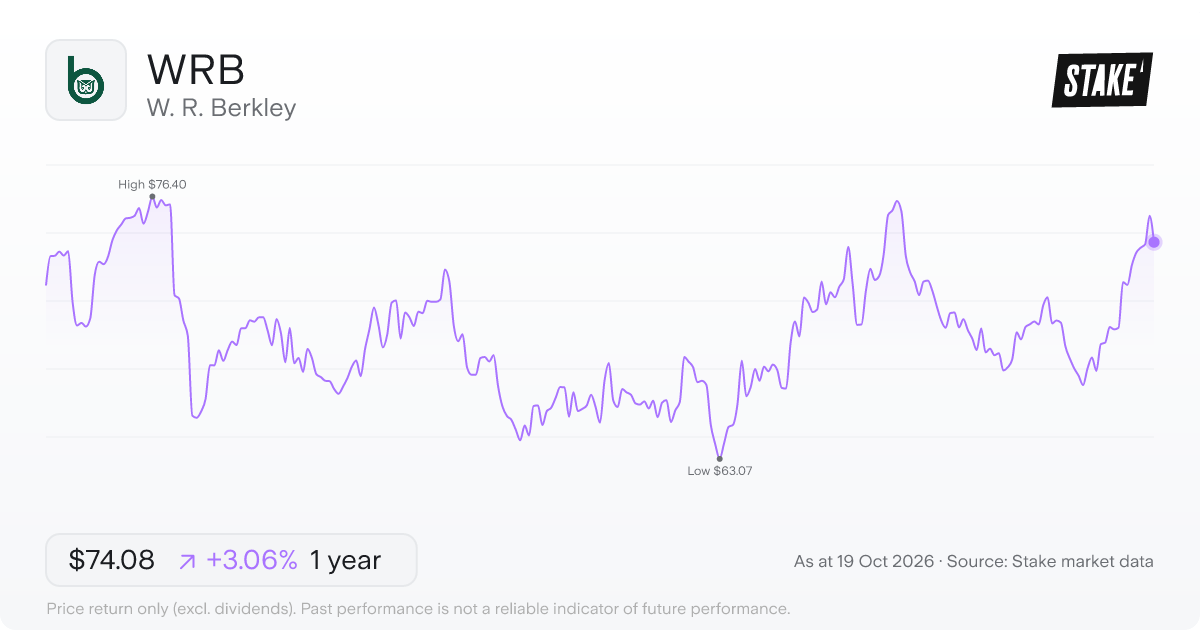
Price: US$74.08 · Daily: -1.8% · Market cap: US$28.00B · Sector: Financials · Industry: Insurance
W. R. Berkley Corporation ($WRB) runs a commercial-focused property casualty insurance business across two main arms: an Insurance segment and a Reinsurance & Monoline Excess segment. The Insurance side writes excess and surplus lines, admitted lines and specialty personal lines, covering everything from agribusiness to accident and health products. Its reach extends well beyond the U.S. – $WRB underwrites insurance in Asia, Australia, Canada, Continental Europe, Mexico, Scandinavia, South America and the United Kingdom.
The Reinsurance & Monoline Excess arm works on both a facultative and treaty basis, operating across the Asia Pacific region, Australia, Continental Europe, South Africa and the United Kingdom. CEO Rob Berkley leads a company of 8,804 employees, structured through a collection of distinct business units each focused on a particular line or market.
7. Markel Group ($MKL)
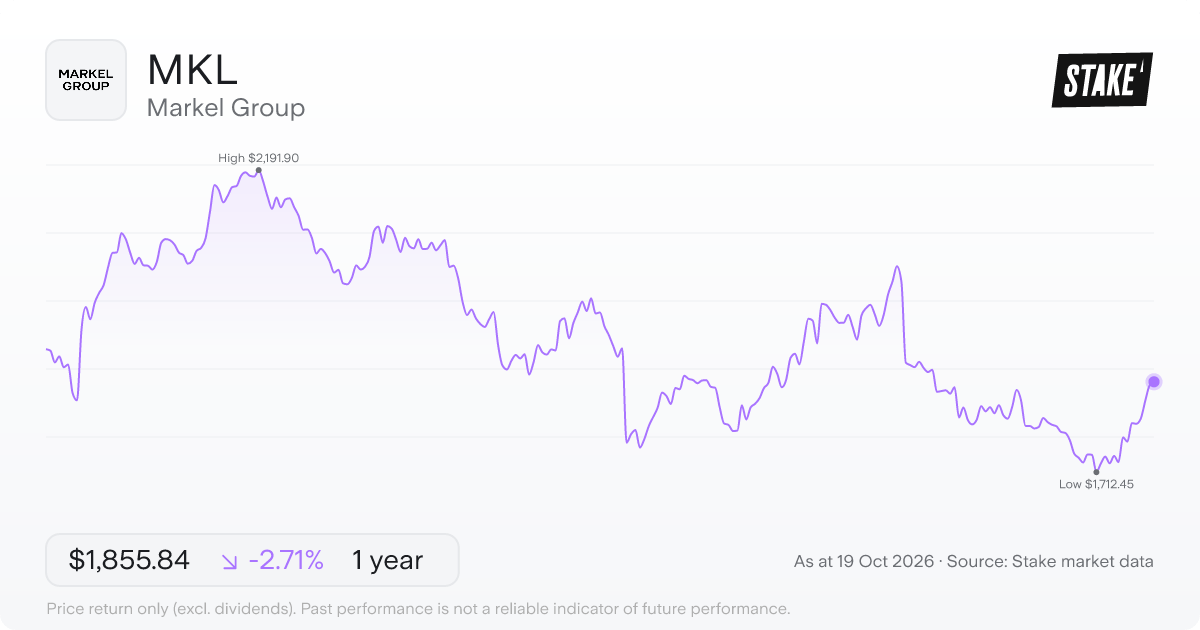
Price: US$1,855.84 · Daily: 0.3% · Market cap: US$22.92B · Sector: Financials · Industry: Insurance
Specialty insurance sits at the core of Markel Group ($MKL), but CEO Tom Gayner oversees a business that extends well beyond underwriting. The Industrial segment covers building products distribution, fire protection and manufacturing lines that include precast concrete, dredges and car hauler equipment. The Consumer and Other segment moves in a different direction – houseplant production, home building, leather handbags and manufactured housing communities all operate under the same corporate umbrella. The Financial segment covers insurance services and investment management. $MKL employs 22,900 people across these four segments.
8. Assurant ($AIZ)
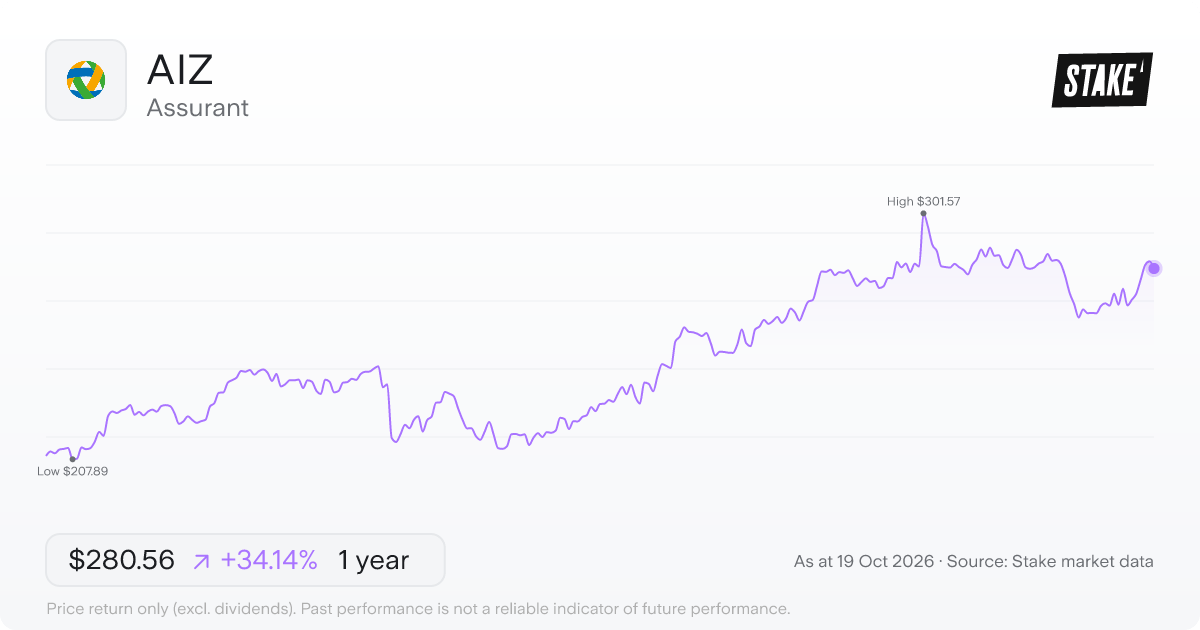
Price: US$280.56 · Daily: -1.0% · Market cap: US$13.97B · Sector: Financials · Industry: Insurance
Assurant ($AIZ) takes a different route to insurance by partnering with consumer brands rather than selling directly to policyholders. Its two operating segments – Global Lifestyle and Global Housing – cover everything from mobile device protection and vehicle service contracts to lender-placed home insurance and renters cover.
Global Lifestyle handles connected devices, consumer electronics, appliances and automotive protection services. Global Housing focuses on homeowners insurance placed through mortgage lenders, plus manufactured housing, flood and renters products. The company runs these operations across North America, Latin America, Europe and Asia Pacific, with Keith Demmings at the helm and around 14,800 employees.
9. CNA Financial ($CNA)
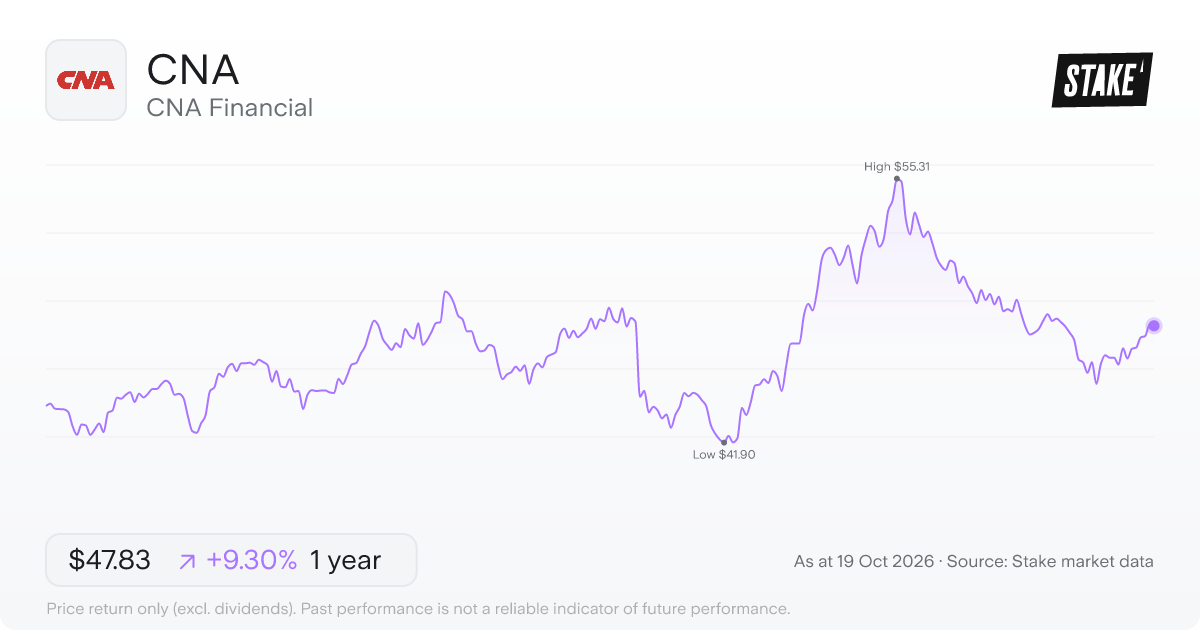
Price: US$47.83 · Daily: -0.1% · Market cap: US$12.96B · Sector: Financials · Industry: Insurance
CNA Financial ($CNA) writes property and casualty insurance across a broad range of customers – from small businesses and construction firms to mid-market commercial accounts – distributing policies through brokers and independent agents rather than selling direct. Its Specialty segment goes further, covering management and professional liability through a network that includes managing general underwriters.
$CNA also underwrites internationally, with operations in Canada, a European presence through insurance companies based in the UK and Luxembourg, and Hardy, its Lloyd's of London syndicate. One segment worth noting is Life & Group, which holds a long-term care book that's in run-off, meaning the company is winding it down rather than writing new policies. CEO Doug Worman leads a workforce of 6,600 people across these operations.
10. American Financial Group ($AFG)
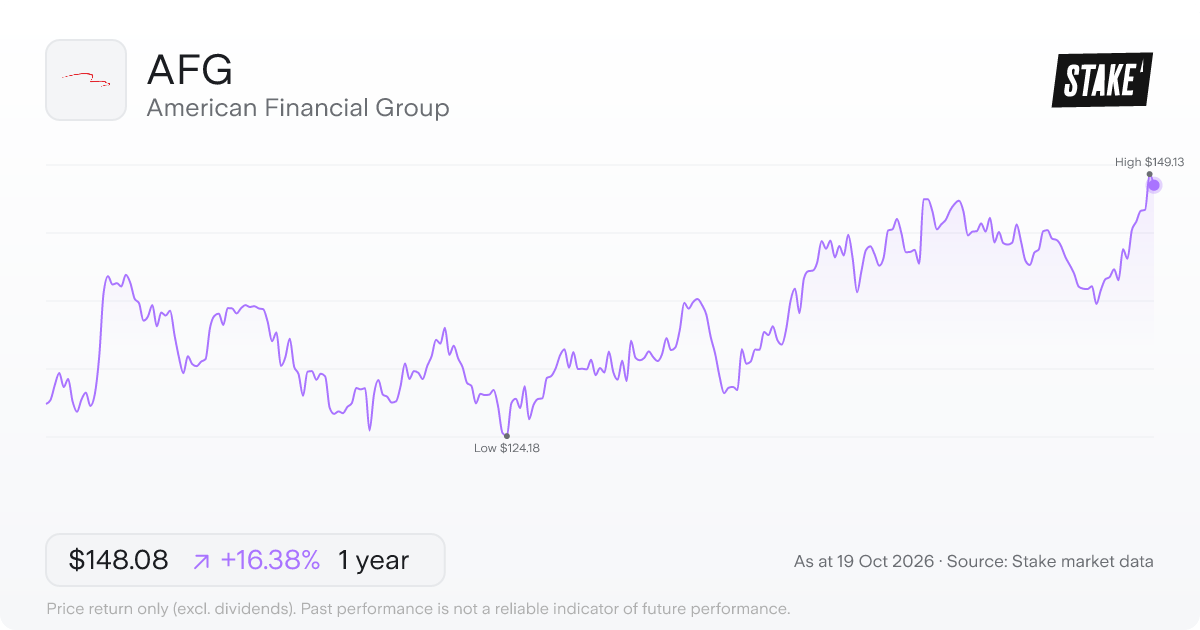
Price: US$148.08 · Daily: -0.7% · Market cap: US$12.37B · Sector: Financials · Industry: Insurance
American Financial Group ($AFG) runs its insurance operations through Great American Insurance Group, a property and casualty insurer that concentrates primarily on commercial customers rather than personal lines like home or auto. The company's focus is specialised – it writes policies for risks that don't fit neatly into standard commercial coverage.
Its property and transportation arm covers physical damage and liability for buses, trucks and other commercial transport, alongside inland and ocean marine and agricultural products. The specialty casualty side handles excess and surplus lines, professional liability and general liability. A third arm – specialty financial – provides risk management programmes for lending and leasing institutions, plus fidelity, surety and trade credit insurance.
Carl Lindner leads the company, which employs around 8,500 people across its operations.
➡️ Top 10 ASX defensive stocks to watch in 2026→
Common questions
How do I invest in US insurance stocks in Australia?
All ten stocks in this list trade on U.S. exchanges, so you'll need a share trading platform with U.S. market access. Purchases settle in USD, meaning you convert AUD at the prevailing exchange rate when you buy and sell. That exchange rate also affects the value of your holding in Australian dollar terms, separately from how the stocks themselves perform.
What are the key risks of US insurance stocks?
Catastrophe exposure sits at the sharper end of the risk spectrum – a severe hurricane season or sustained wildfire activity can produce claims large enough to wipe out an entire year's underwriting profit. Reserve risk matters too: if a company underestimates how much it will eventually pay on existing claims, topping up those reserves later flows through as a loss. Insurers also hold substantial bond portfolios to match their liabilities, so interest rate movements affect both investment returns and the value of those holdings. Companies with global operations face the added complexity of currency movements and varying regulatory environments across jurisdictions.
How do insurance companies generate profit?
Insurers earn from two places: underwriting and investing. On the underwriting side, they collect premiums and try to pay out less in claims and operating costs than they take in – the surplus is underwriting profit. While waiting to pay claims, they invest those premiums (commonly called the float) in bonds and other securities, generating investment income alongside. A company's earnings reflect both how accurately it priced risk and how its investment portfolio performed.
How do the companies in this list differ from each other?
The companies here cover quite different territory. Some focus on standard personal lines – home and car policies sold to individuals – while others are built around specialty commercial risks, excess-and-surplus lines, or reinsurance. $AIG writes policies across more than 200 countries, while several names in the list are primarily U.S.-focused. $MKL sits apart from the others: specialty insurance is central to the group, but it also owns a mix of industrial and consumer businesses through its holding company structure.
More resources
✅ Top 10 ASX blue chip shares to watch in 2026→
Disclaimer
Past performance is not a reliable indicator of future performance. When you invest, your capital is at risk. You should consider your own investment objectives, financial situation, and particular needs before making an investment decision. The value of your investments can go down as well as up and you may receive back less than your original investment. As always, do your own research and consider seeking appropriate financial advice before investing.
This is not personal financial advice nor a recommendation to invest in the securities listed. Any advice provided by Stake is of general nature only and does not take into account your specific circumstances. Trading and volume data from the Stake investing platform is for reference purposes only, the investment choices of others may not be appropriate for your needs and is not a reliable indicator of performance.
Please refer to hellostake.com/pricing for the fees that apply. When you trade securities priced in another currency, currency conversion fees may apply and movements in the exchange rate may affect your returns.

Stake Desk
The freshest market insights
This article combines AI and human review from our analysts to bring you accurate, informative investing content at speed. For questions or suggestions, contact stakedesk@stake.com.au.
Subscribe
By subscribing, you agree to our Privacy Policy.