
Top 10 airline stocks to watch in 2026

These planes shift people and packages all over the world. Airline in the name doesn't mean flying is the whole business — Delta owns a refinery.
Airlines earn from selling seats on scheduled routes, but the revenue mix also includes cargo, loyalty programmes and ancillary fees like baggage and onboard sales. Delta Air Lines ($DAL) is the only carrier in this list that also runs its own jet fuel refinery, supplying fuel to its fleet directly rather than sourcing it entirely from third parties.
How we built this list: We selected these companies based on their industry and ordered them by market capitalisation. Prices are updated daily, and the list and supporting content are reviewed roughly every quarter. All data is sourced from Stake. This list isn't a recommendation and isn't ordered by suitability.
Company Name | Ticker | Share Price | Market Cap | In Watchlists |
|---|---|---|---|---|
Delta Air | $75.37 | $51.37B | 4857 | |
United Arlns | $96.10 | $32.88B | 1541 | |
Ryanair Holdings PLC | $52.54 | $26.06B | 387 | |
International Consolidated Airlines Group, S.A. | $11.00 | $23.92B | 13 | |
Southwest | $39.50 | $19.97B | 1526 | |
LATAM Airlines Group S.A. | $47.47 | $13.92B | 385 | |
Deutsche Lufthansa AG | $8.09 | $9.71B | 37 | |
American Airline | $11.88 | $8.13B | 5672 | |
Copa Holdings | $132.92 | $5.47B | 99 | |
Alaska Air Group | $35.13 | $4.07B | 397 |
Past performance is not a reliable indicator of future performance.
Source: Stake market data. Figures in US$. Data updated as of 16 October 2026.
✅ Learn more: Top 10 ASX blue chip shares to watch in 2026→
Sign up in minutes and get access to a CHESS-sponsored platform, where you can explore Airline stocks and more.
1. Delta Air ($DAL)
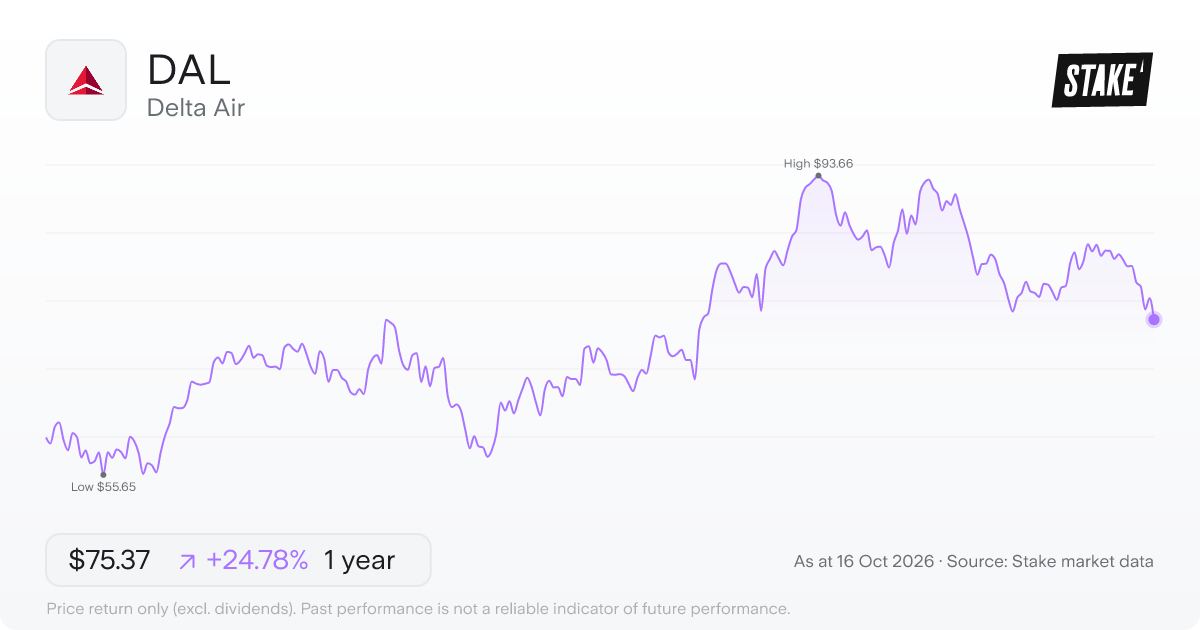
Price: US$75.37 · Daily: -3.5% · Market cap: US$51.37B · Sector: Industrials · Industry: Passenger Transport
Delta Air Lines ($DAL) connects passengers and cargo across a network of hubs running from Atlanta and New York through to London-Heathrow, Tokyo, Seoul-Incheon and São Paulo. CEO Ed Bastian oversees a workforce of 103,000 people across the business.
Two segments make up $DAL's operations. The airline side covers scheduled routes, the loyalty programme and ancillary fees like baggage charges. The refinery produces jet fuel for Delta's own fleet, drawing on third-party supply agreements to fill any gaps in its output – and the refinery also generates non-jet fuel products as part of that process.
2. United Arlns ($UAL)
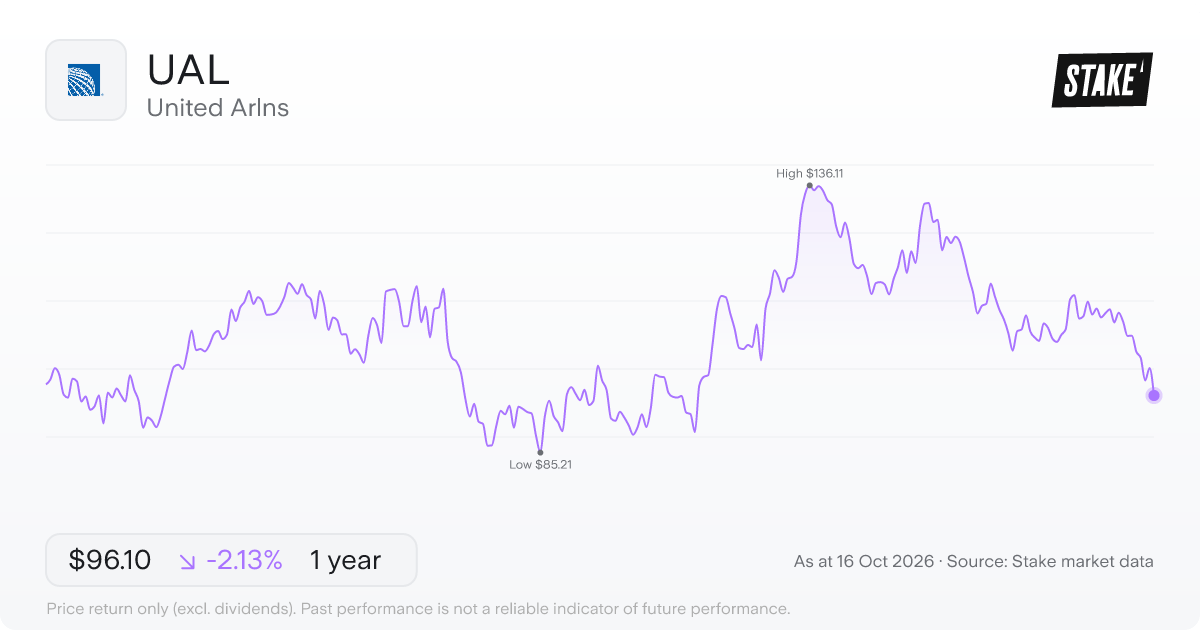
Price: US$96.10 · Daily: -5.1% · Market cap: US$32.88B · Sector: Industrials · Industry: Passenger Transport
United Airlines Holdings ($UAL) operates through its main carrier, United Airlines, and a network of regional partners flying under the United Express brand. Its hub-and-spoke model connects passengers across more than six continents, routing traffic through eight major hubs including Chicago O'Hare, Newark, Los Angeles and San Francisco.
Beyond passenger seats, $UAL also moves freight and mail through its Air Cargo division. The carrier's reach covers North America, Asia, Europe, Africa, the Middle East, Latin America and the Pacific. Chief executive J. Scott Kirby leads a workforce of 113,200 employees.
3. Ryanair Holdings PLC ($RYAAY)
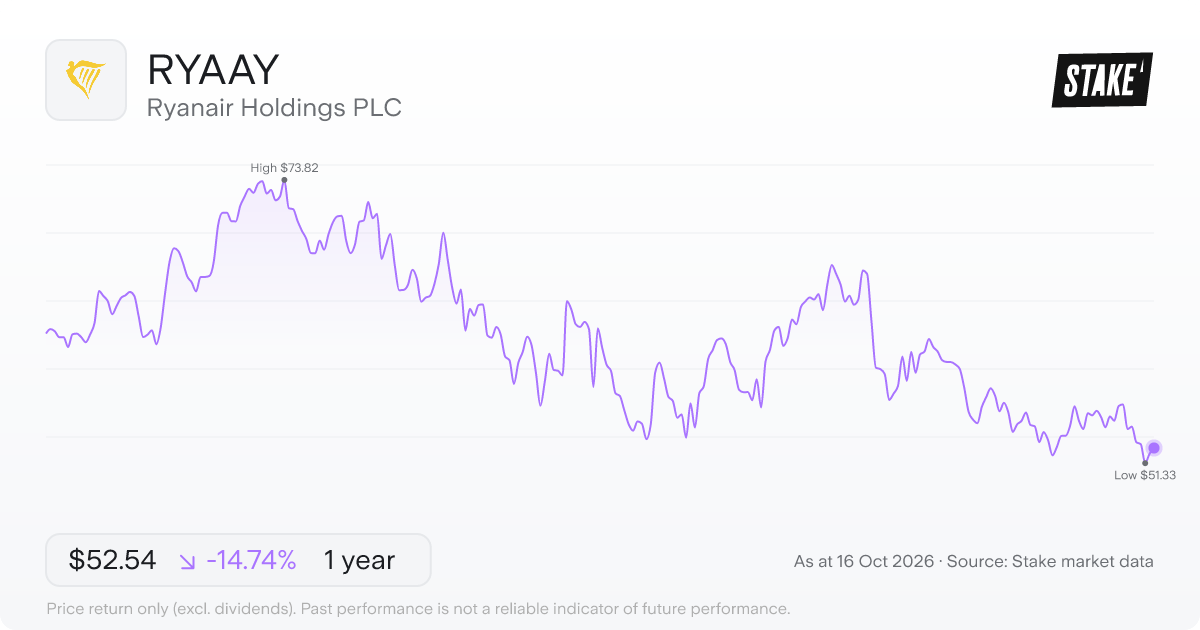
Price: US$52.54 · Daily: 0.9% · Market cap: US$26.06B · Sector: Industrials · Industry: Passenger Transport
Ryanair Holdings PLC ($RYAAY) isn't a single airline – it's a group of five: Buzz, Lauda Europe, Malta Air, Ryanair DAC and Ryanair UK. The combined operating fleet runs to roughly 636 aircraft, a mix of Boeing 737 variants and Airbus A320s.
Beyond selling seats, $RYAAY earns from a wide range of ancillary services: in-flight food and drink, duty-free sales, car hire arranged through a contract with Rental Cars, and travel insurance and accommodation marketed through its website and app. CEO Mike O'Leary oversees a workforce of 25,711 employees across the group.
4. International Consolidated Airlines Group, S.A. ($ICAGY)
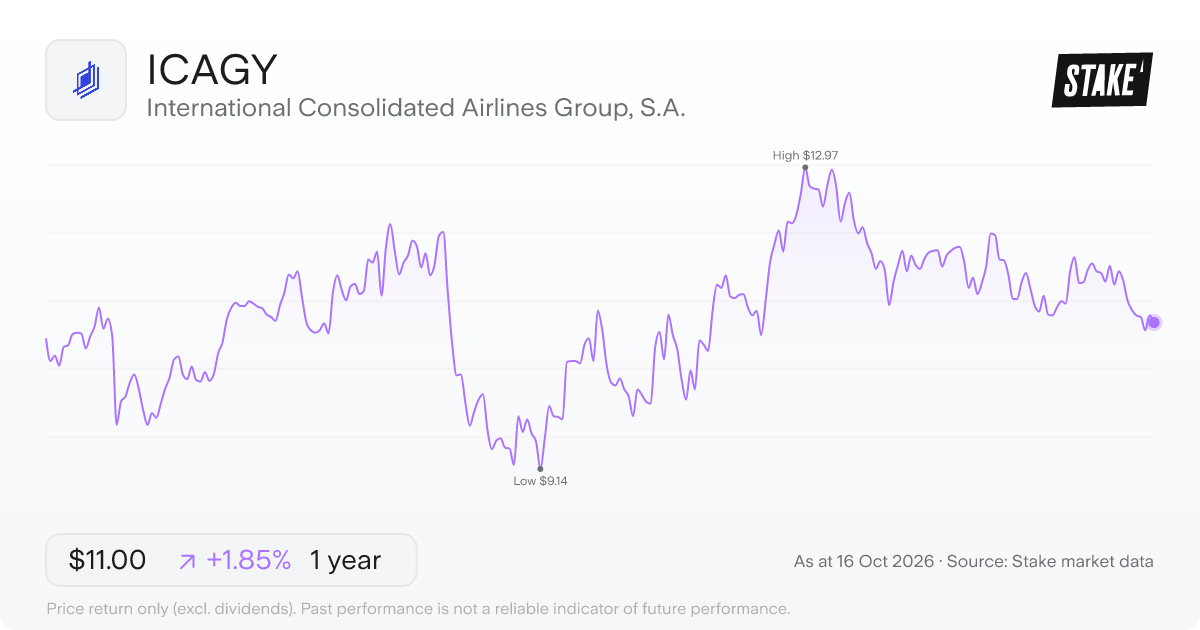
Price: US$11.00 · Daily: -0.8% · Market cap: US$23.92B · Sector: Industrials · Industry: Passenger Transport
International Consolidated Airlines Group, S.A. ($ICAGY) is a holding company built around four airline brands: British Airways, Iberia, Vueling and Aer Lingus. Each operates as a distinct carrier under the group structure, together employing around 75,786 people.
Revenue comes from more than selling seats. $ICAGY runs cargo operations through IAG Cargo Limited, maintains aircraft through British Airways Avionic Engineering Limited, and offers inflight eCommerce via IAG Connect Limited. IAG Loyalty ties the group's frequent-flyer activity together across its brands.
5. Southwest ($LUV)
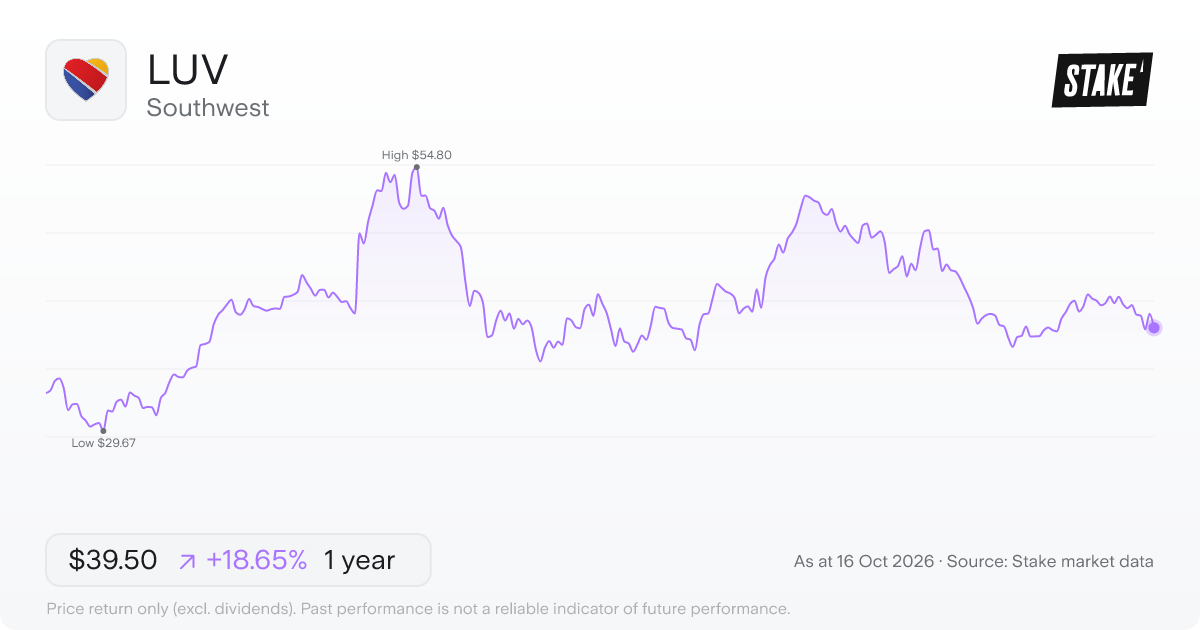
Price: US$39.50 · Daily: -3.3% · Market cap: US$19.97B · Sector: Industrials · Industry: Passenger Transport
Southwest Airlines ($LUV) covers 117 destinations across 42 states, the District of Columbia, Puerto Rico and ten near-international countries. The company employs 72,790 people and runs a fleet of over 803 Boeing 737 aircraft – no other aircraft type in the mix.
$LUV structures its fares across four tiers: Wanna Get Away, Wanna Get Away Plus, Anytime and Business Select, each carrying different levels of flexibility and extras. The Rapid Rewards loyalty programme earns members points on every dollar spent on base fares, with points also accruing on gift card and flight credit purchases.
Join 1M+ on Stake
Effortless investing in U.S. shares & ETFs
6. LATAM Airlines Group S.A. ($LTM)
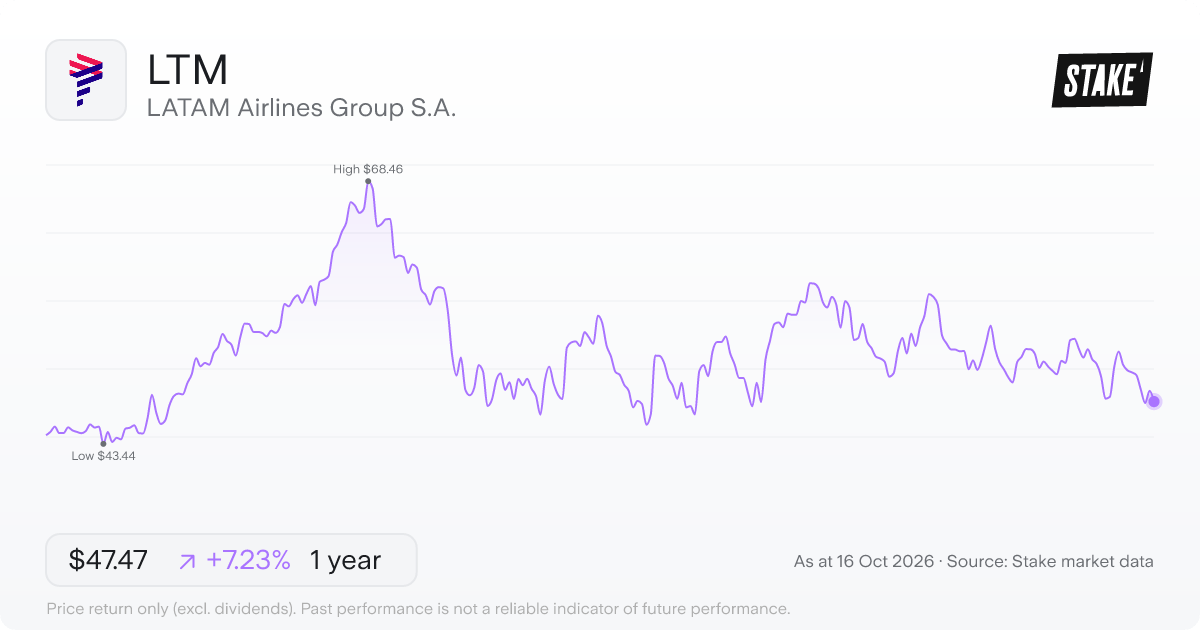
Price: US$47.47 · Daily: -2.1% · Market cap: US$13.92B · Sector: Industrials · Industry: Passenger Transport
LATAM Airlines Group S.A. ($LTM) is the South American carrier covering domestic routes across Chile, Peru, Argentina, Colombia, Ecuador and Brazil, plus regional and international services reaching the Americas, Europe and Oceania. Its fleet runs to over 329 aircraft, mixing Airbus and Boeing wide-bodies including the A350-900 and Boeing 787 series.
Beyond selling seats, $LTM runs a loyalty programme called Multiplus – a coalition-based frequent flyer scheme that operates as a separate business segment alongside the core air transport network. The company employs 41,125 people and is led by chief executive Roberto Alvo Milosawlewitsch.
7. Deutsche Lufthansa AG ($DLAKY)
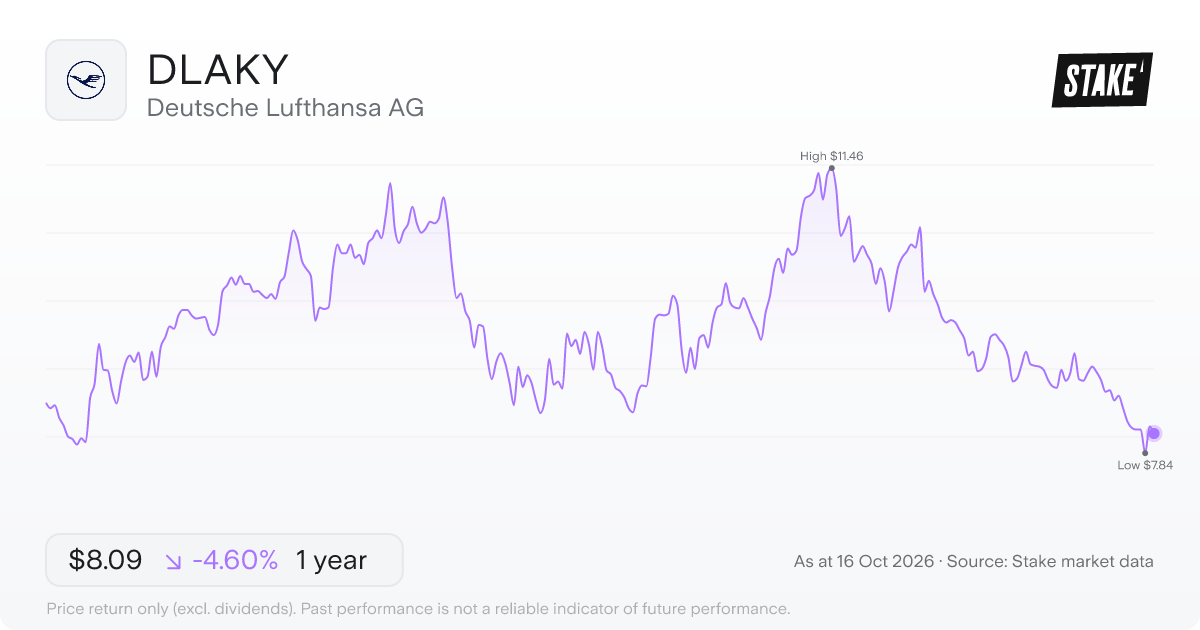
Price: US$8.09 · Daily: -1.1% · Market cap: US$9.71B · Sector: Industrials · Industry: Passenger Transport
Deutsche Lufthansa AG ($DLAKY) operates five passenger airlines – Lufthansa Airlines, SWISS, Austrian Airlines, Brussels Airlines and Eurowings. Under CEO Carsten Spohr, the group's 103,255 employees work across businesses that extend well beyond scheduled routes.
Lufthansa Technik, the group's maintenance, repair and overhaul arm, services civil and commercial aircraft for operators around the world. The logistics division holds a 50% stake in cargo airline AeroLogic and runs specialist units covering airfreight container management, urgent shipments and tailored e-commerce freight solutions.
8. American Airline ($AAL)
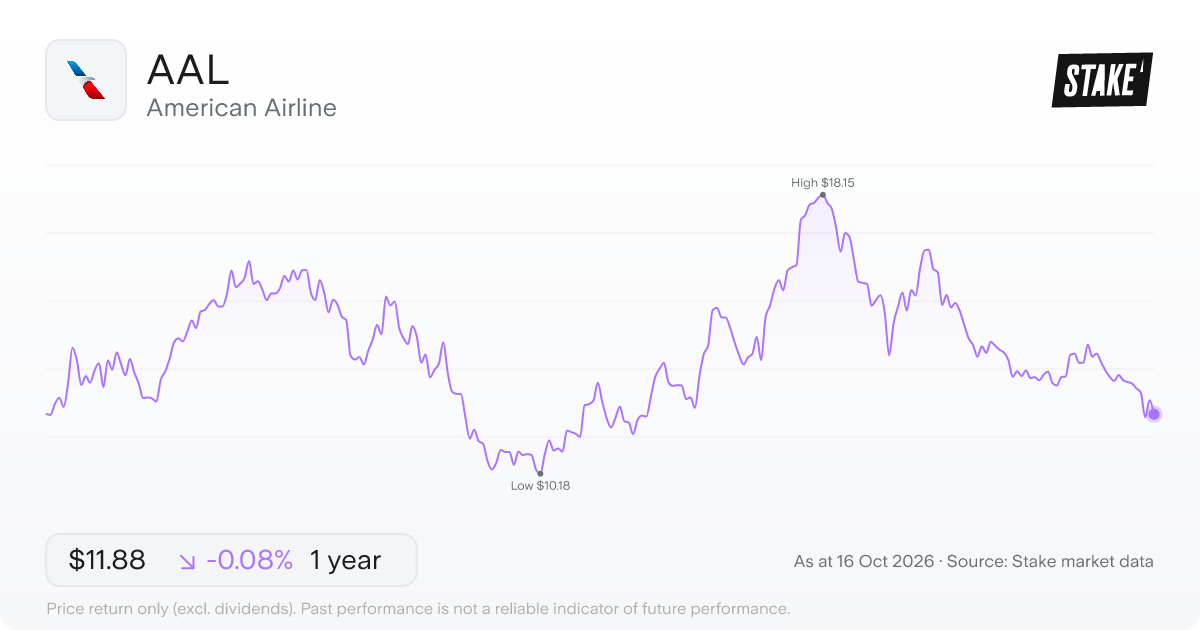
Price: US$11.88 · Daily: -3.3% · Market cap: US$8.13B · Sector: Industrials · Industry: Passenger Transport
American Airlines Group ($AAL) operates one of the U.S.'s major network carriers, running scheduled passenger and cargo flights through nine domestic hubs – Charlotte, Chicago, Dallas/Fort Worth, Los Angeles, Miami, New York, Philadelphia, Phoenix and Washington, D.C. Partner gateways extend that reach to cities including London, Doha, Madrid, Sydney and Tokyo, among others.
$AAL's mainline fleet runs to around 1,013 aircraft, with a further 567 regional aircraft operated through subsidiaries and third-party carriers under the American Eagle banner. Those regional subsidiaries include Envoy Aviation Group, PSA Airlines and Piedmont Airlines. The cargo division adds freight and mail services on top of the passenger business, with interline connections across the globe.
Robert Isom leads the group, which employs around 139,100 people.
9. Copa Holdings ($CPA)
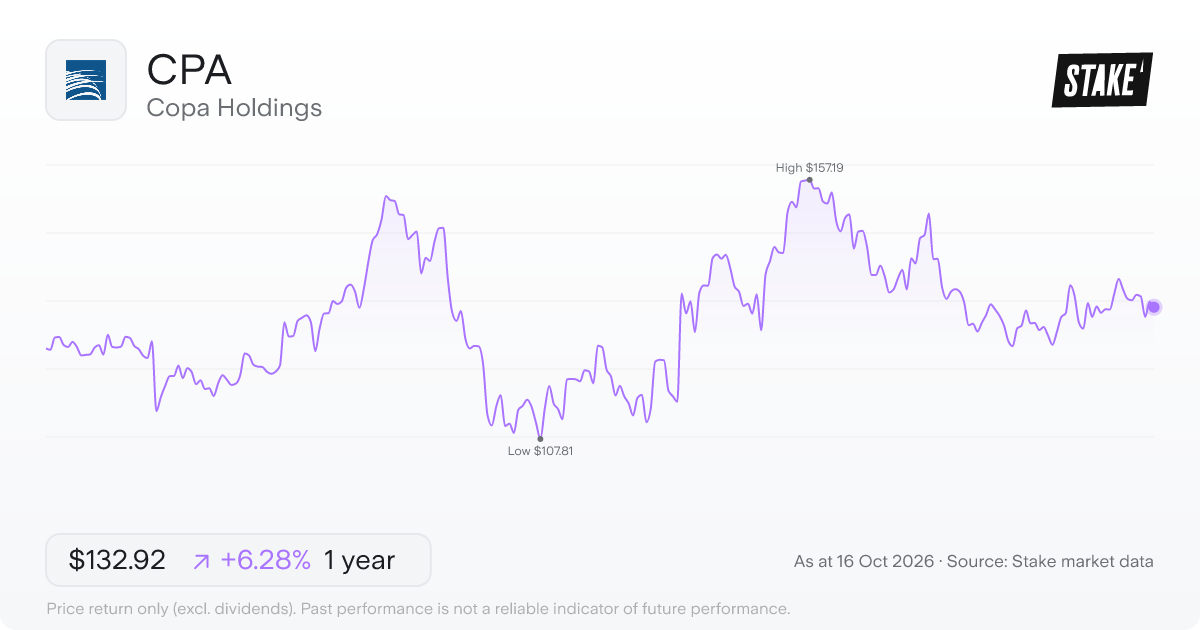
Price: US$132.92 · Daily: -0.7% · Market cap: US$5.47B · Sector: Industrials · Industry: Passenger Transport
Copa Holdings ($CPA) runs two airline businesses out of Latin America. Copa Airlines operates from a hub in Panama City, connecting passengers across the region on international routes. Copa Colombia handles domestic flights within Colombia and international services to destinations including Panama, Venezuela, Ecuador, Mexico, Cuba, Guatemala and Costa Rica.
The Panama City hub is the core of the operation – Copa Airlines routes traffic through it rather than running a point-to-point network. Copa Colombia, by contrast, does use a point-to-point model for its international flying. A subsidiary called Oval Financial Leasing controls the special purpose entities that hold a beneficial interest in most of the fleet, which is how $CPA manages aircraft financing off the main balance sheet.
Pedro Heilbron leads the company as CEO, and $CPA employs around 8,565 people across its operations. Revenue comes from passenger fares, cargo and mail services across both subsidiaries.
10. Alaska Air Group ($ALK)
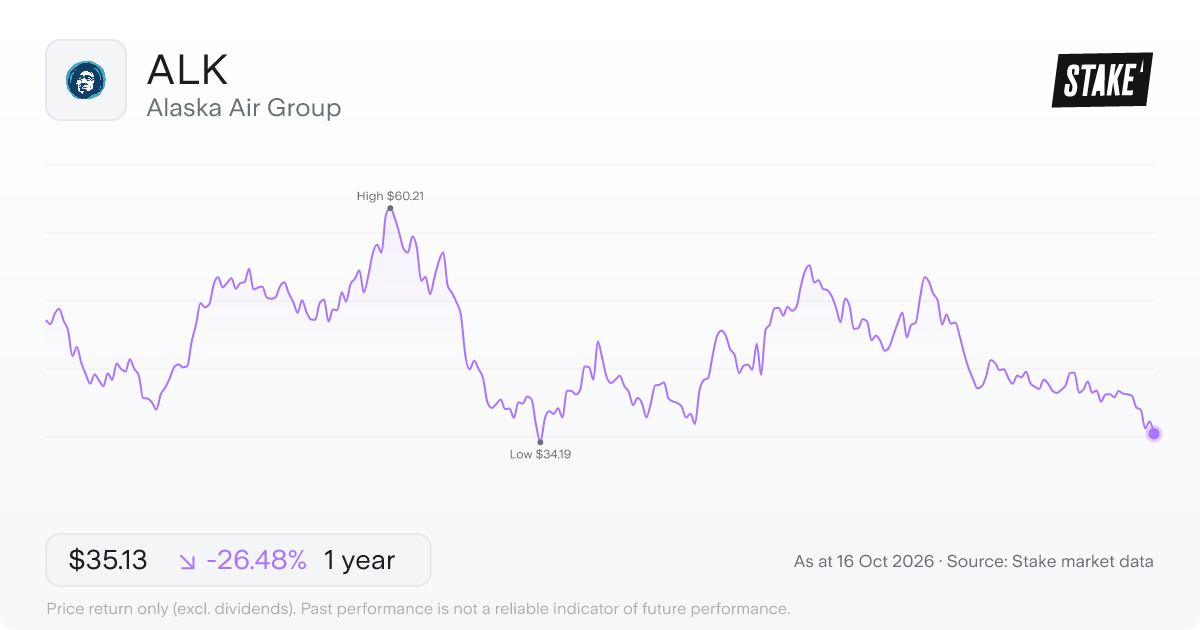
Price: US$35.13 · Daily: -3.8% · Market cap: US$4.07B · Sector: Industrials · Industry: Passenger Transport
Alaska Air Group ($ALK) sits behind three passenger-carrying brands: Alaska Airlines, Hawaiian Airlines, and a regional operation run largely through Horizon Air Industries. Between them, the group covers more than 140 destinations across North America, Central America, Asia and the Pacific.
The Alaska Airlines fleet mixes Boeing and Airbus types – 737s and 787s alongside A330s and A321neos – giving the group range from short domestic hops to long transpacific routes. The regional arm flies Embraer E175 jets under capacity purchase agreements, where a third-party carrier operates on $ALK's behalf in exchange for a fixed fee rather than bearing its own revenue risk. That structure keeps thinner routes open without $ALK absorbing all the operating cost directly.
Cargo is also part of the mix. $ALK carries freight and mail using both dedicated freighter aircraft and the belly space on its passenger fleet. CEO Ben Minicucci leads a workforce of nearly 32,000 people across the group's operations.
➡️ Top 9 drone stocks to watch in 2026→
Common questions
How can I invest in airline stocks in Australia?
All ten stocks in this list trade on U.S. markets and are priced in USD. Australian investors can buy them through a share trading platform that supports U.S. markets. Because purchases settle in USD, the AUD value of any position moves with both the stock price and the AUD/USD exchange rate.
What are the key risks of airline stocks?
Fuel is typically one of the largest costs an airline carries, so oil price movements flow quickly through to margins. Passenger demand is cyclical – volumes tend to fall in economic downturns, yet fixed costs like aircraft leases and staffing remain regardless of how full the planes are. External shocks – geopolitical disruption, disease outbreaks, severe weather – can ground routes or suppress travel demand with little warning. Many carriers also hold substantial debt, which amplifies the pressure when revenues soften.
How do network carriers differ from budget airlines?
Network carriers – like Delta, United and American – run hub-and-spoke systems that channel passengers through major airports onto connecting routes across multiple continents, usually paired with multiple cabin classes, cargo operations and loyalty programs. Budget carriers like Ryanair focus on direct point-to-point routes, fly standardised fleets and charge separately for add-ons, with the model designed to keep base fares low. The list covers both ends of that spectrum, so the companies here can respond quite differently to the same fuel price move or drop in passenger demand.
More resources
✅ Top 10 ASX defensive stocks to watch in 2026→
Disclaimer
Past performance is not a reliable indicator of future performance. When you invest, your capital is at risk. You should consider your own investment objectives, financial situation, and particular needs before making an investment decision. The value of your investments can go down as well as up and you may receive back less than your original investment. As always, do your own research and consider seeking appropriate financial advice before investing.
This is not personal financial advice nor a recommendation to invest in the securities listed. Any advice provided by Stake is of general nature only and does not take into account your specific circumstances. Trading and volume data from the Stake investing platform is for reference purposes only, the investment choices of others may not be appropriate for your needs and is not a reliable indicator of performance.
Please refer to hellostake.com/pricing for the fees that apply. When you trade securities priced in another currency, currency conversion fees may apply and movements in the exchange rate may affect your returns.

Stake Desk
The freshest market insights
This article combines AI and human review from our analysts to bring you accurate, informative investing content at speed. For questions or suggestions, contact stakedesk@stake.com.au.
Subscribe
By subscribing, you agree to our Privacy Policy.