Charting just got a power up
Introducing an array of enhanced charting features for the Stake app. See more, do more and get more from your charts, wherever you are.
Here's what's new
Expanded View
Richer analysis starts with this button. Tap it to unlock crosshair functionality, orders from the chart and more.
.png&w=3840&q=100)
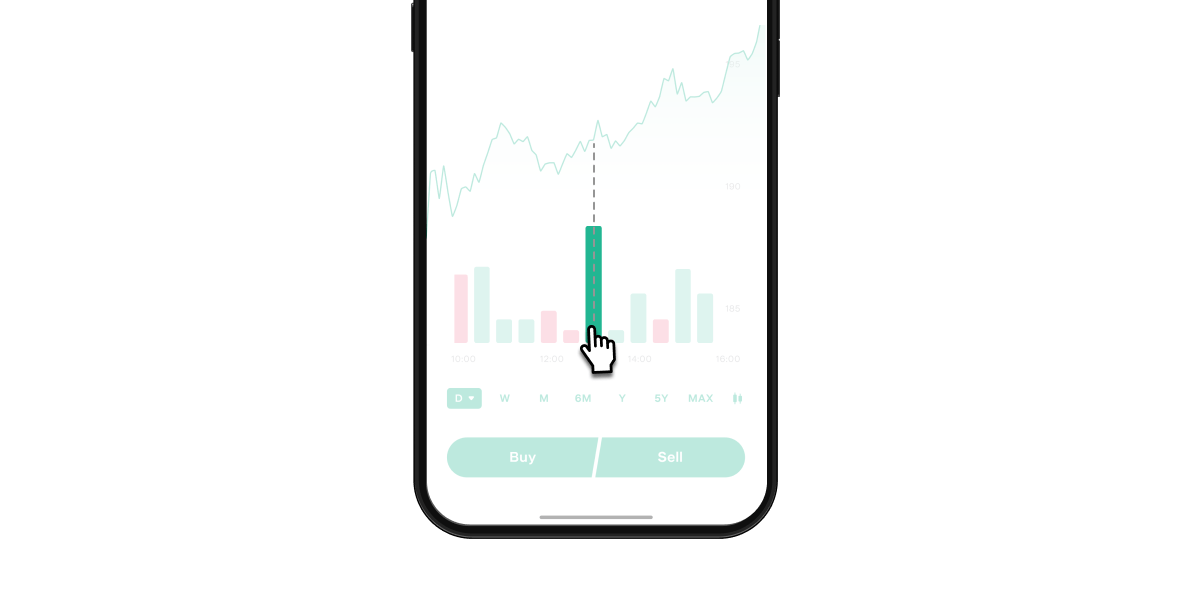
Volume
You can now see trade volume right on the chart. The columns indicate the number of shares traded in any given period.

Map your trades
Getting the whole story of your investments is simpler than ever. See the points at which you’ve bought or sold a stock, along with your average buy price.
.png&w=3840&q=100)
Compare between points
Be precise with intuitive point-to-point price tracking. Simply hold two fingers on the chart to see the price change from start to end date.
.png&w=3840&q=100)
Extended Hours charting for Wall St
See the price movements in pre-market and after hours sessions reflected in the charts (Stake Wall St only).
.png&w=3840&q=100)
There’s always something new to discover, and now you have even more insights at your fingertips. Give the new features a test drive today and take your analysis to the next level.